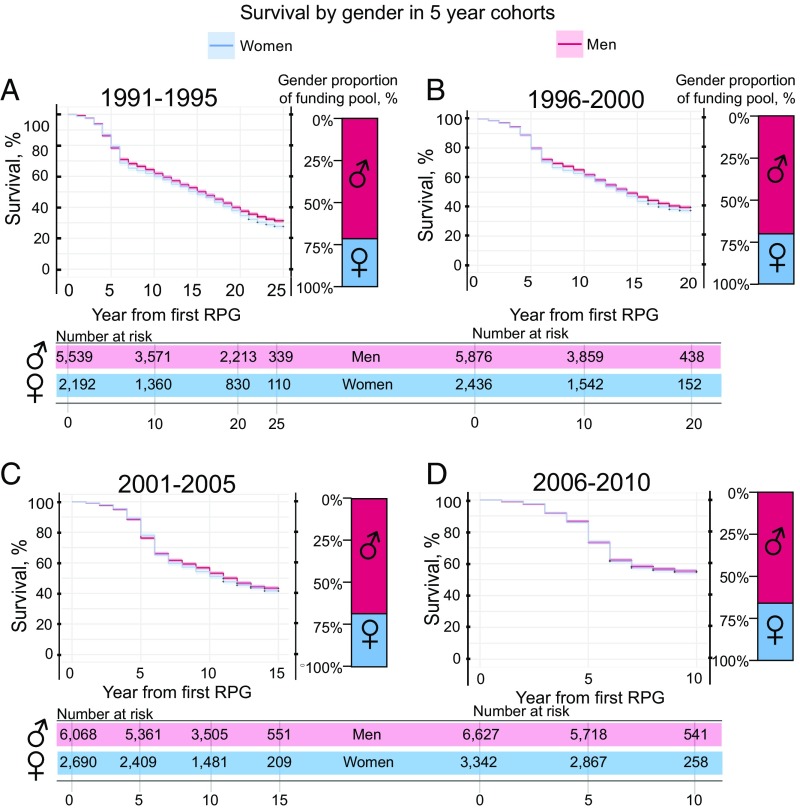
Fig. 2.
Kaplan–Meier survival curves, by gender, for each cohort. The numbers of individuals at risk are below the plots, and the percentages of women and men initially funded are to the right; 95% CIs are shown (Greenwood’s formula). Results are shown by cohort based on the year of first RPG. (A) In 1991–1995, women (28.35% of the cohort) left the funding pool at a slightly higher rate than men [women, n = 2,192; men, n = 5,539; MH: χ2(1) = 6.6, P = 0.01; GW: χ2(1) = 3.9, P = 0.05]. (B) In 1996–2000, women (29.31% of the cohort) left the funding pool at slightly higher rates than men [women, n = 2,436; men, n = 5,876; MH: χ2(1) = 4.6, P = 0.03; GW: χ2(1) = 4.0, P = 0.05]. (C) In 2001–2005, women (30.71%) and men showed no statistically significant survival difference [women, n = 2,690; men, n = 6,068; MH: χ2(1) = 2.1, P = 0.14; GW: χ2(1) = 1.1, P = 0.31]. (D) In 2006–2010, women (33.52%) and men showed no statistically significant survival difference [women, n = 3,342; men, n = 6,627; MH: χ2(1) = 0.2, P = 0.68; GW: χ2(1) = 0.1, P = 0.74].

