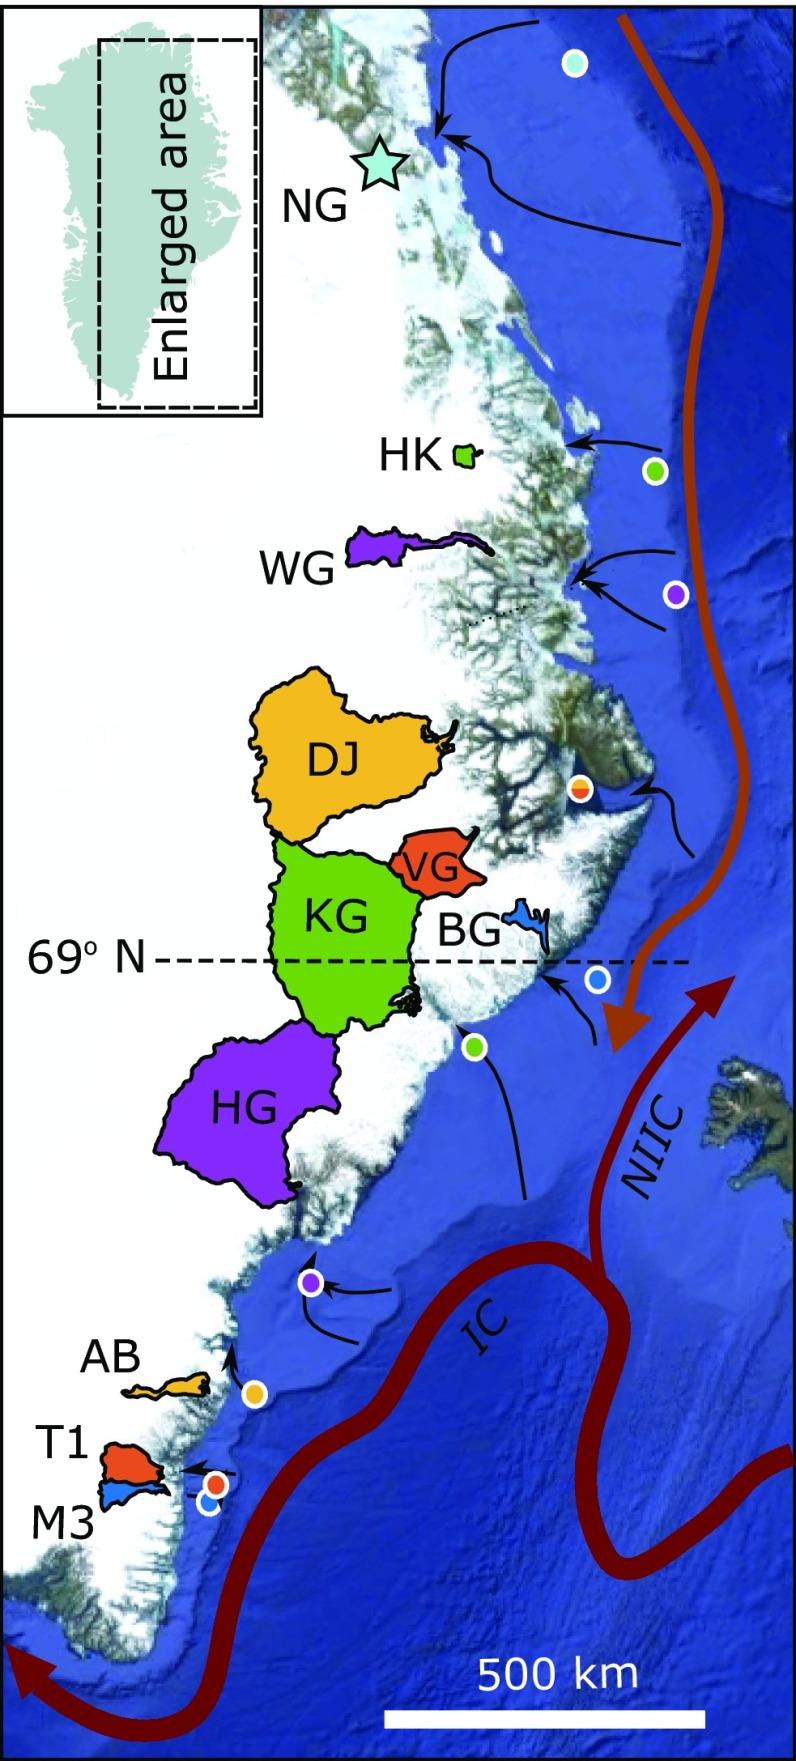
Fig. 1.
Map showing the location of the 10 study glaciers (SI Appendix, Table S1) in east Greenland: AB; BG, Borggraven; DJ; HG; HK, Heinkel Glacier; KG, Kangerdlugssuaq Glacier; M3; T1, Tingmjarmiut 1; VG, Vestfjord Glacier; WG. The location of Nioghalvfjerdsbræ (NG), which is referenced but does not constitute one of the study glaciers, is marked with a star. Hydrological catchments are shaded, and the divide between the northern and southern study glaciers at ∼69° N is marked with the dashed line. The sample locations for ocean reanalysis temperature for the glaciers are shown as colored circles. Also shown are the approximate locations of warm ocean currents (22), with IC, Irminger Current and NIIC, North Iceland Irminger Current, and cross-shelf troughs that may allow warm subsurface waters to access the study glaciers (black arrows; ref. 44). The background image shows a satellite mosaic of Greenland with shaded sea-floor bathymetry [Google Earth; Data: Scripps Institution of Oceanography (SIO), National Oceanic and Atmospheric Administration (NOAA), US Navy, National Geospatial-Intelligence Agency (NGA), General Bathymetric Chart of the Oceans (GEBCO); Image: Landsat/Copernicus, International Bathymetric Chart of the Arctic Ocean (IBCAO), US Geological Survey].

