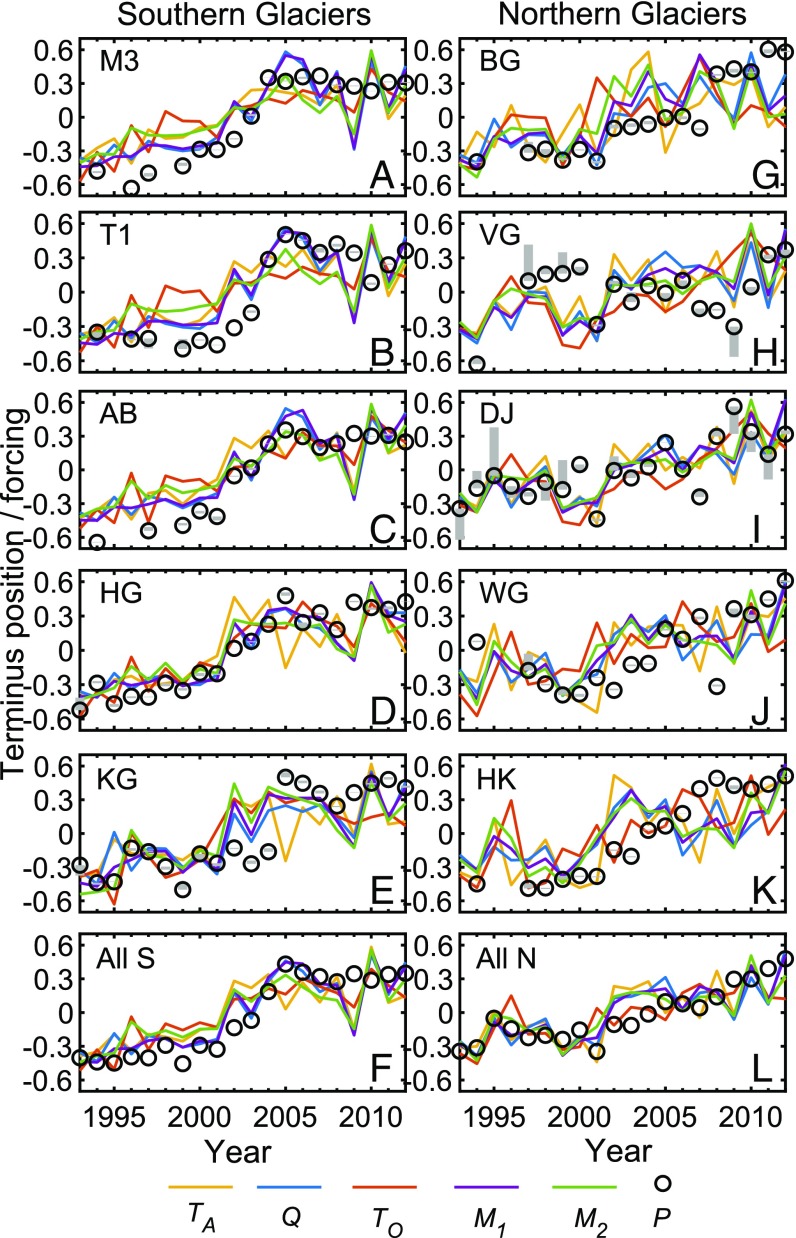
Fig. 3.
Time series of normalized anomalies in air temperature (, orange), runoff (, blue), ocean temperature (, red), (purple), and (green), and terminus position (, black circles) for (A–E) southern glaciers, and (G–K) northern glaciers. F and L show the combined southern and northern glaciers, respectively. Anomalies are expressed relative to the 20-y mean, and all values are normalized with respect to the observed range at that glacier. For ease of comparison, is shown inverted (i.e., positive change means retreat) and is in some cases discontinuous due to lack of observations. Vertical gray bars indicate the adjustment of P relative to Pmean (SI Appendix).

