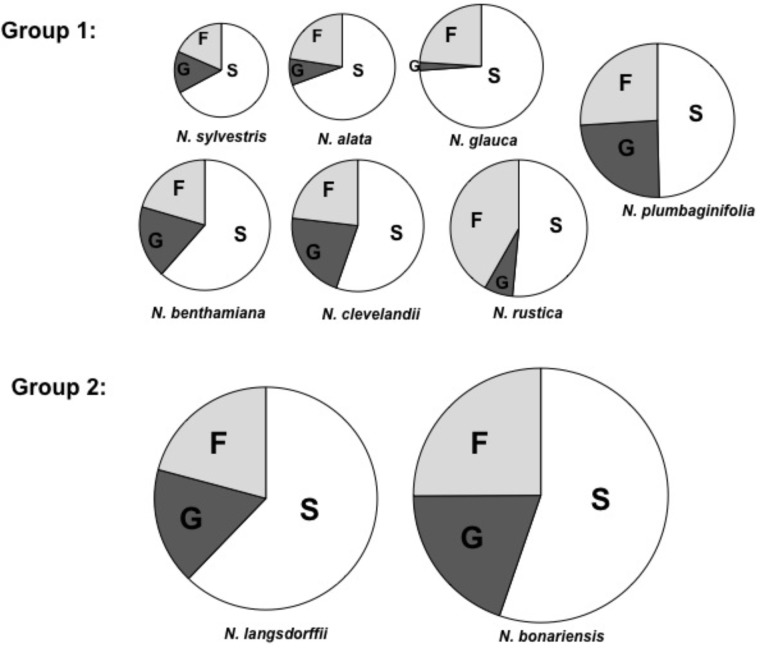
FIGURE 1.
Carbohydrate composition of selected tobacco species. Proportions of fructose (F), glucose (G), and sucrose (S) in nectar. The area of each circle represents the total mass of sugar found in each nectar sample. Each segment represents the mean of three samples. Averages ± standard deviation (N = 3). All characteristics of each nectar are present in Table 3. Group 1, total nectar carbohydrate < 560 mM, Group 2, total nectar carbohydrate > 1000 mM.

