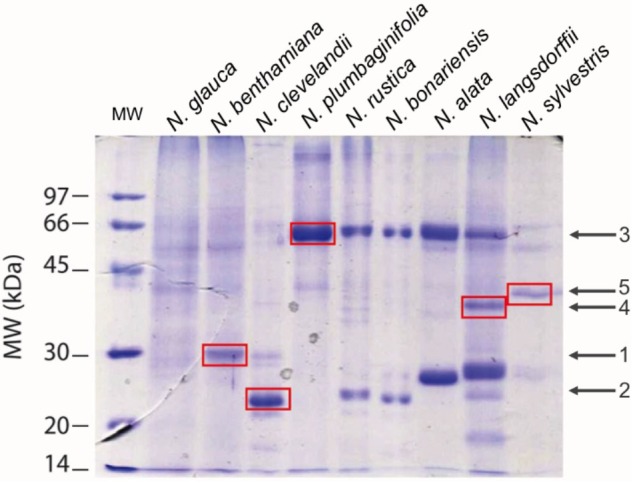
FIGURE 5.

Patterns of nectar proteins by SDS-PAGE 12.5%. In each lane was applied 1.25 μgP of raw nectar. Averages ± standard deviation. The standard profile was obtained from the analysis of three different independent experiments (N = 3). The proteins were stained with Coomassie Blue. Averages ± standard deviation (N = 3).
