
FIGURE 10.
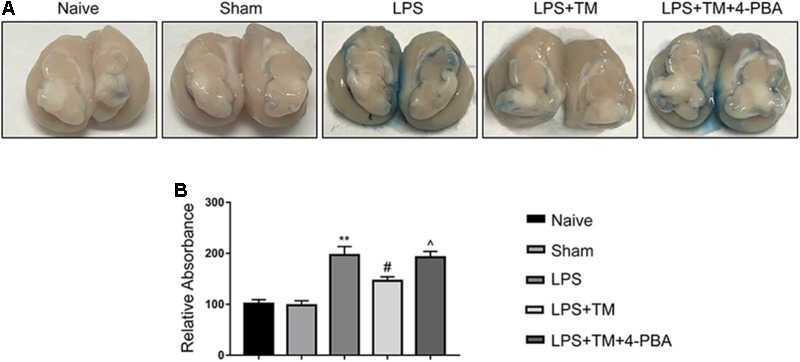
Mild ER stress reduced EB extravasation in the LPS-treated rats. (A) Representative photographs of EB extravasation in the extracted brains of various groups. (B) The quantitative analysis of EB leakage. Each value was expressed relative to the values of the naïve group, which was set to 100 (n = 4). The data are presented as the mean ± SEM. ∗P < 0.05, ∗∗P < 0.01 vs. naïve group. #P < 0.05, ##P < 0.01 vs. LPS treatment group. ∧P < 0.05, ∧∧P < 0.01 vs. TM treatment group.