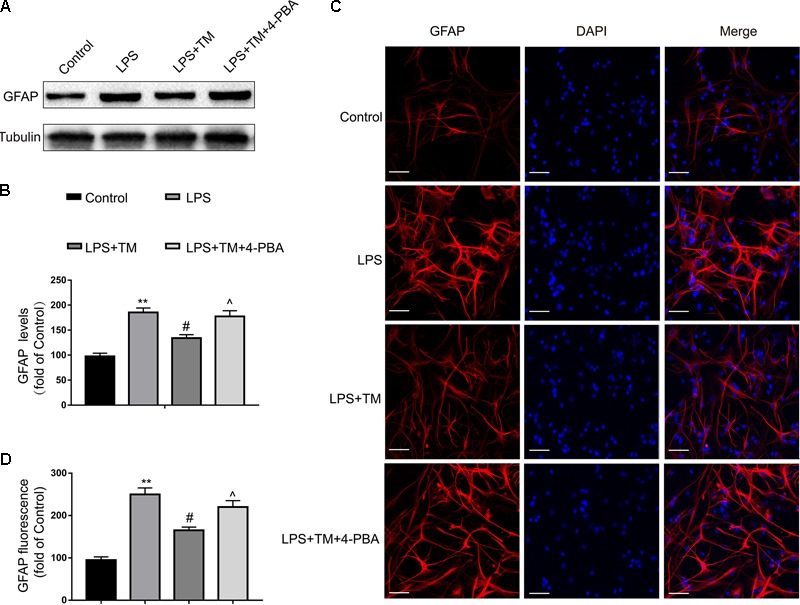
FIGURE 4.

Mild ER stress alleviated astrocyte activation. (A) The protein levels of GFAP were detected by Western blotting using specific antibody in the primary astrocytes. (B) Expression of GFAP was quantified and normalized to Tubulin levels. Each value is expressed relative to that in the control group, which was set to 100. (C) Astrocyte was stained with GFAP antibody as indicated. Blue staining represents DAPI. Scale bar = 25 μm. (D) Quantitative data of the mean intensity of GFAP fluorescence in primary astrocytes. Each value is expressed relative to that in the control group, which was set to 100. All experiments were repeated three times. ∗P < 0.05, ∗∗P < 0.01 vs. control group. #P < 0.05, ##P < 0.01 vs. LPS treatment group. ∧P < 0.05, ∧∧P < 0.01 vs. TM treatment group. The data are presented as the mean ± SEM.
