
FIGURE 8.
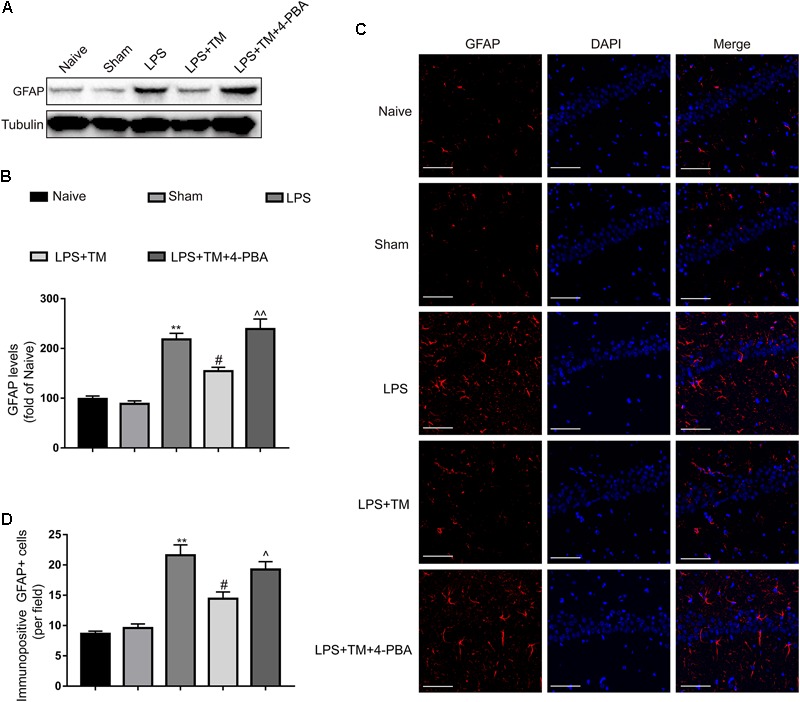
Mild ER stress reduced the hippocampal astrocyte activation. (A) The protein levels of GFAP were detected by Western blotting using specific antibody in hippocampus. (B) Expression of GFAP was quantified and normalized to Tubulin levels. Each value was expressed relative to that of the naïve group, which was set to 100 (n = 6). (C) Immunofluorescent staining was used to detect GFAP, a maker of astrocytes, in hippocampal CA1 region. Blue staining represents DAPI. Scale bar = 200 μm. (D) Quantitative of GFAP-positive cells in the CA1 area of hippocampus. The data are representative of three independent experiments. ∗P < 0.05, ∗∗P < 0.01 vs. naïve group. #P < 0.05, ##P < 0.01 vs. LPS treatment group. ∧P < 0.05, ∧∧P < 0.01 vs. TM treatment group. The data are presented as the mean ± SEM.