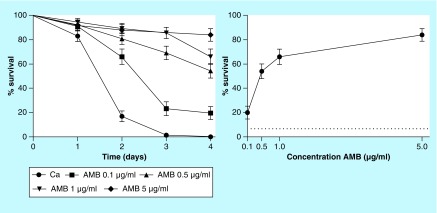
Figure 1. . Survival curve and concentration response of amphotericin B from the Caenorhabditis elegans–Candida albicans model.
The graph represents combined data expressed as mean and standard error mean from three independent experiments. Survival curves were plotted using the Kaplan–Meier method, and survival curves were compared by log-rank test. All concentrations of amphotericin B significantly increased the survival rate of worms (p < 0.0001).
AMB: Amphotericin B.

