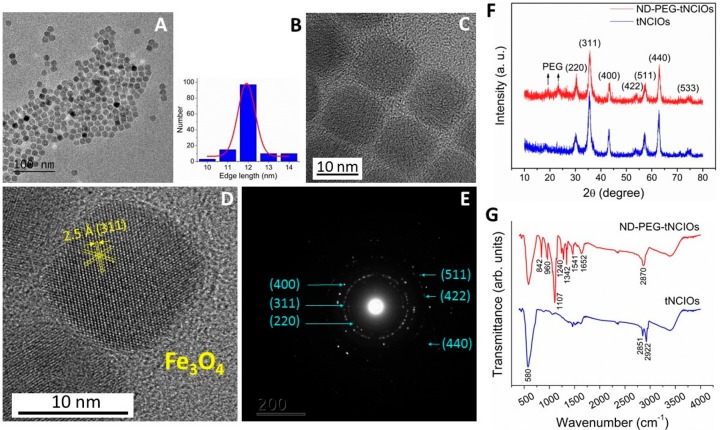
Figure 1.
(A) TEM image of as-synthesized oleic acid-coated tNCIOs (scale bar: 10 nm). (B) Size distribution profile of tNCIOs and Gaussian fitting, as seen from the TEM image. (C, D) High-resolution TEM (HRTEM) images of tNCIO. (E) Selected area electron diffraction (SAED) patterns. (F) Powder XRD patterns and (G) ATR-FTIR spectra of tNCIOs and ND-PEG-tNCIOs.

