Figure 1.
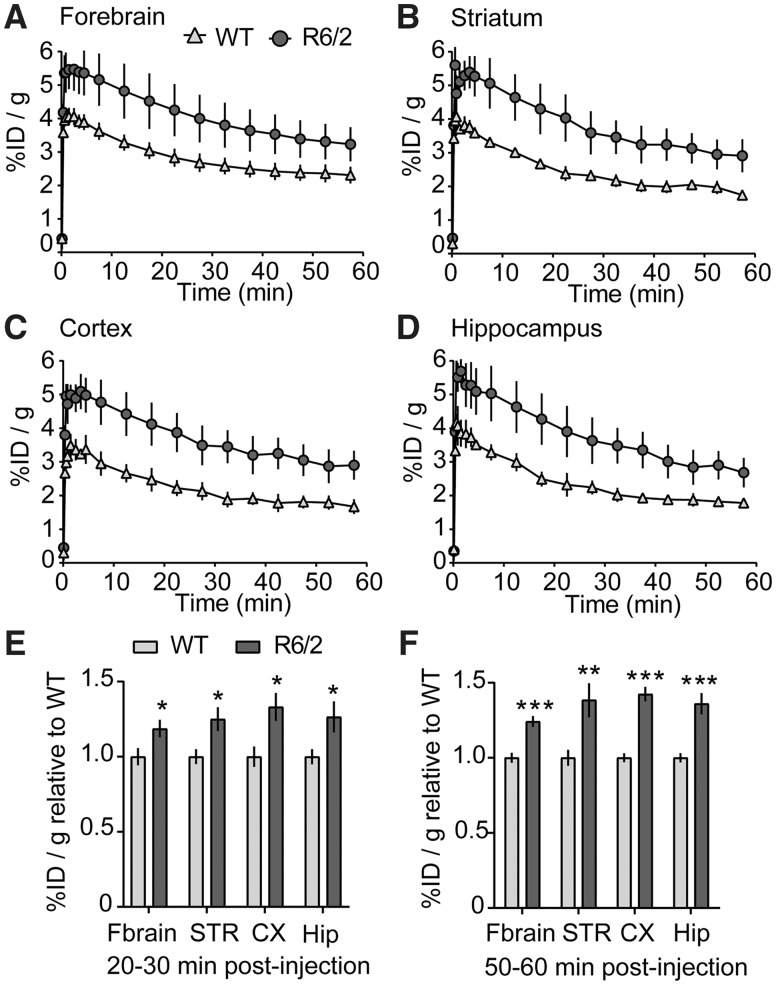
[18F]PBR06-PET imaging detects elevated TSPO in brains of 11- to 12-week-old R6/2 mice. Time–radioactivity curves depicting [18F]PBR06 uptake [% injected dose/gram (%ID/g)] in the forebrain (Fbrain; A), striatum (STR; B), cortex (CX; C), and hippocampus (Hip; D) of 11- to 12-week-old R6/2 mice (n = 4) and their WT littermates (n = 3). (E) Quantification of [18F]PBR06 accumulation showed that uptake was significantly higher in R6/2 mice versus WTs (n = 3 and 4 mice, respectively) at 20–30 min post-injection of radiotracer in the forebrain and each predefined region of interest. (F) [18F]PBR06 uptake remained significantly higher in R6/2 mice at 50–60 min when combined with 10 min static scans acquired at ∼50 min post-tracer injection (n = 5 WT mice; n = 7 R6/2 mice). Results are expressed as %ID/g mean ± s.e.m. Data were normalized to WT mice within each PET scan in (E) and (F) to minimize variability between imaging sessions. Statistical significance was determined with a two-tailed Mann–Whitney U test in (E) and a two-tailed Student’s t-test in (F). *P ≤ 0.05, **P ≤ 0.01, ***P ≤ 0.001 versus WT.

