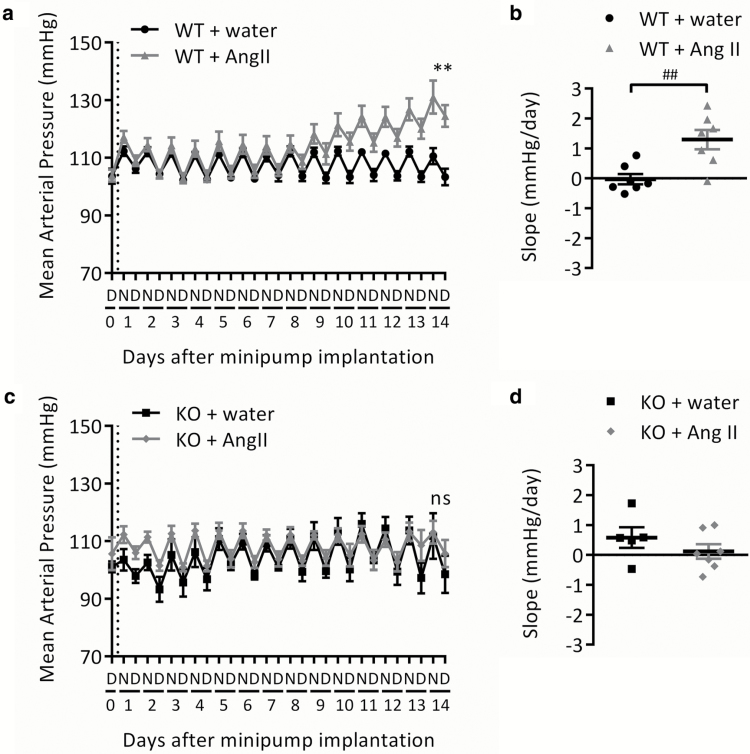
Figure 2.
Change in mean arterial blood pressure in wild-type and GPR35 KO mice during 2-week Ang II infusion. Mean arterial blood pressure in (a,b) WT or (c,d) GPR35 KO mice. Baseline measurements were taken on day 0 prior to minipump implantation (indicated by dotted line). (a,c) 12-hour means representing night (N) and day (D) periods. (b,d) Change over 14 days presented as slope of the linear regression (mm Hg/day) for each individual animal. Data are mean ± SEM of n = 7 (except GPR35 KO + water, n = 5). **P < 0.01, compared using 2-tailed unpaired t test (water vs. Ang II on day 14). ##P < 0.01, compared using 2-tailed unpaired t test (water vs. Ang II). Abbreviations: Ang II, angiotensin II; GPR35, G protein–coupled receptor 35; KO, knockout; ns, not significant; WT, wild type.

