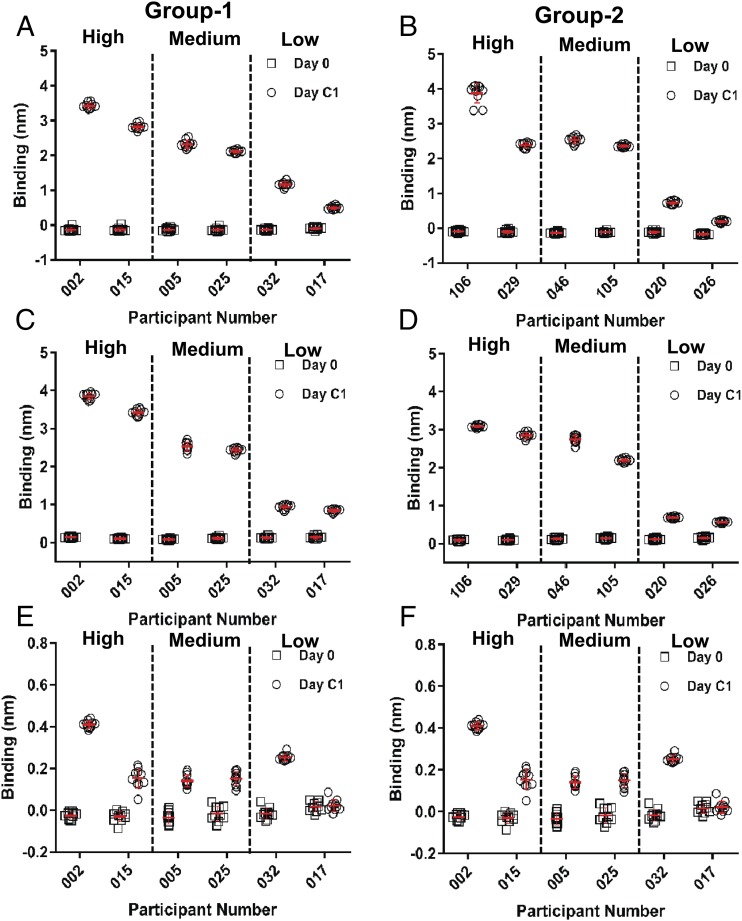
FIGURE 6.
BLI measurement of Ag-specific binding responses of malaria vaccine recipients’ serum. Preimmune (day 0) and postvaccination (day C1) serum of group 1 (A, C, and E) and group 2 (B, D, and F) VAC055 study participants at a 1:50 dilution in PBS buffer binding to CSP-FL (A and B), NANP6 (C and D), and PF16 (E and F) Ags measured in the BLI assay are shown. The mean (horizontal red lines) and SD (vertical error bar in red) of 10 replicates of each serum binding to CSP Ags are indicated. In all panels, vaccinees previously observed to have high-, medium-, and low-Ab titers against CSP Ags are separated by vertical dashed lines as indicated.

