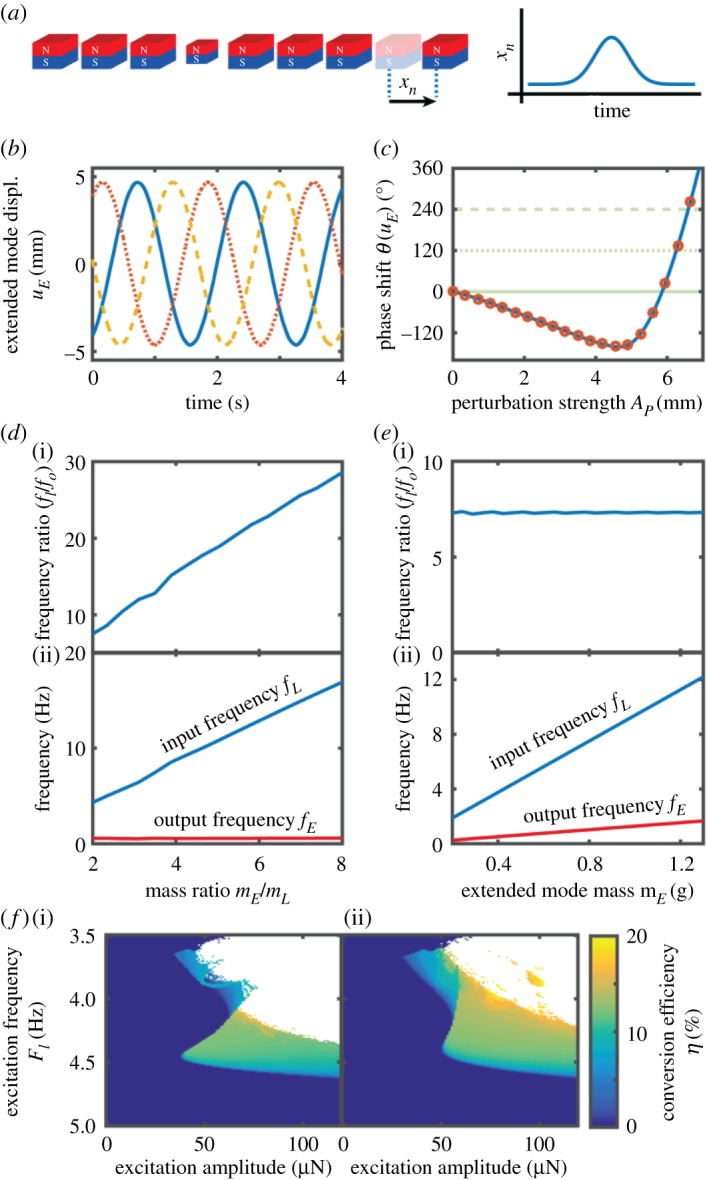
Figure 6.

Theoretical investigation of phase and frequency tunability. (a) Phase tuning scheme. The output signal's phase is tuned by moving the last particle (xn) following a Gaussian profile. (b) Extended mode signal 1790 s after the phase-shifting perturbation has been effected. The lines correspond to perturbations with A0 equal to 0 mm (blue, solid), 6.2562 mm (red, dotted) and 6.5917 mm (yellow, dashed). (c) Output phase as a function of the maximum displacement of the phase-adjusting perturbation. The blue solid line is measured 1790 s after the perturbation, while the circles are measured 1000 s after the first measurement, 2790 s after the perturbation's peak. (b) and (c) have been obtained by integrating the full equation of motion (equation (4.1)) with d0 = 16.3 mm, mi,i≠11 = 0.45 g, m11 = 0.197 g, bi,i≠11 = 306.83 µNs m−1, b11 = 42.62 µNs m−1, Fi,i≠11 = 0 N, F11 = FI sin 2πfit, FI = 48.45 µN and fI = 4.38 Hz. The force-law parameters are as described in the Theoretical model section. (d) Frequency down-conversion ratio (i) and input and output frequencies (ii) as a function of the mass ratio between the defect and extended modes. These plots have been obtained by keeping the extended mode's mass constant and modifying the defect's mass. (e) Frequency down-conversion ratio (i) and input and output frequencies (ii) as a function of the extended mode mass, while keeping the modal mass ratio mE/mL constant. (f) Conversion efficiency as a function of the excitation frequency and amplitude, calculated with the experimentally determined extended mode damping (i) and with twice the damping (ii). Points that are not coloured correspond to combinations of excitation frequency and amplitude for which the system does not have a steady-state solution. In this figure, all parameters are identical to those in figure 3f unless otherwise indicated. (Online version in colour.)
