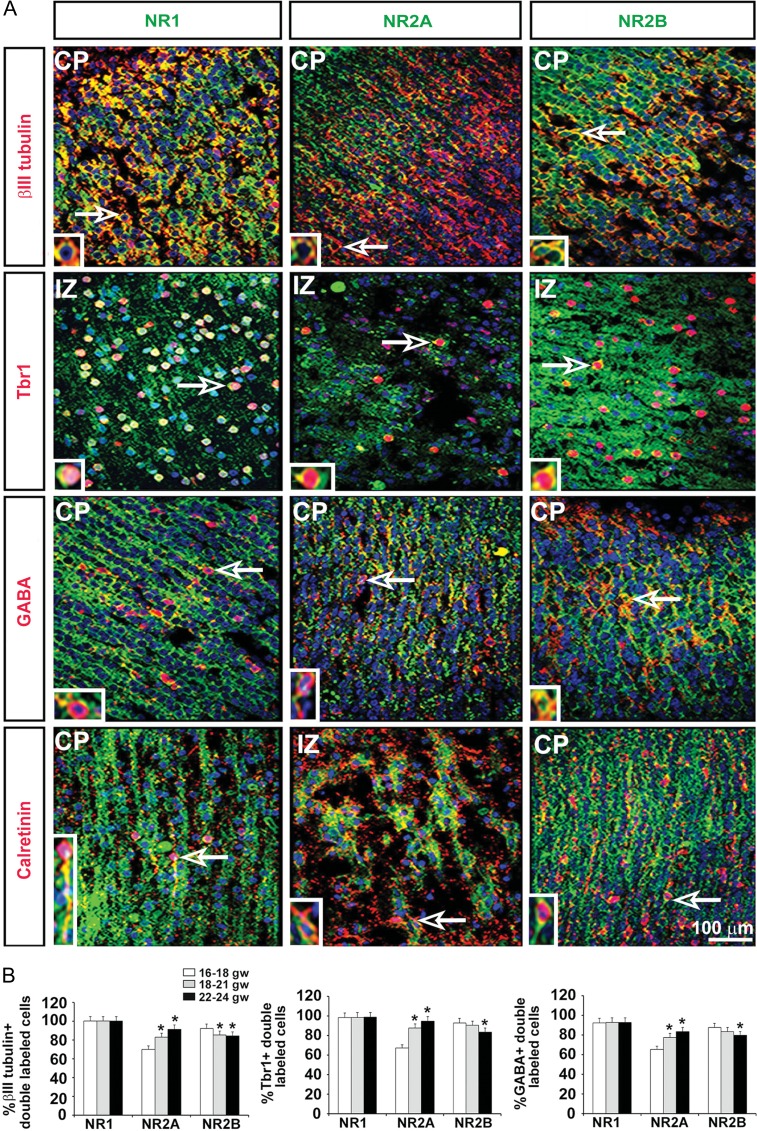
Figure 5.
Expression of NMDAR subunits on cortical neurons. (A) Representative images at 17 gw. Double immunolabeling experiments with antibodies against the NR1, NR2A, and NR2B NMDAR subunits (green) and the neuronal subtypes (red) βIII tubulin (neurons), Tbr1 (glutamatergic), GABA (interneurons), and calretinin (interneuron subtype) in the cortical plate (CP) and the transient intermediate zone (IZ). Cell nuclei stained blue with BB. Arrows point to cells presented on higher magnification in the inset. (B) Quantification of the percentage of βIII tubulin+ neurons, Tbr1+ glutamatergic neurons, and GABA+ interneurons expressing the 3 NMDAR subunits in the 3 age groups studied (n = 3 per age group; P < 0.05). The mean values are plotted; the error bars represent ± the SEM.

