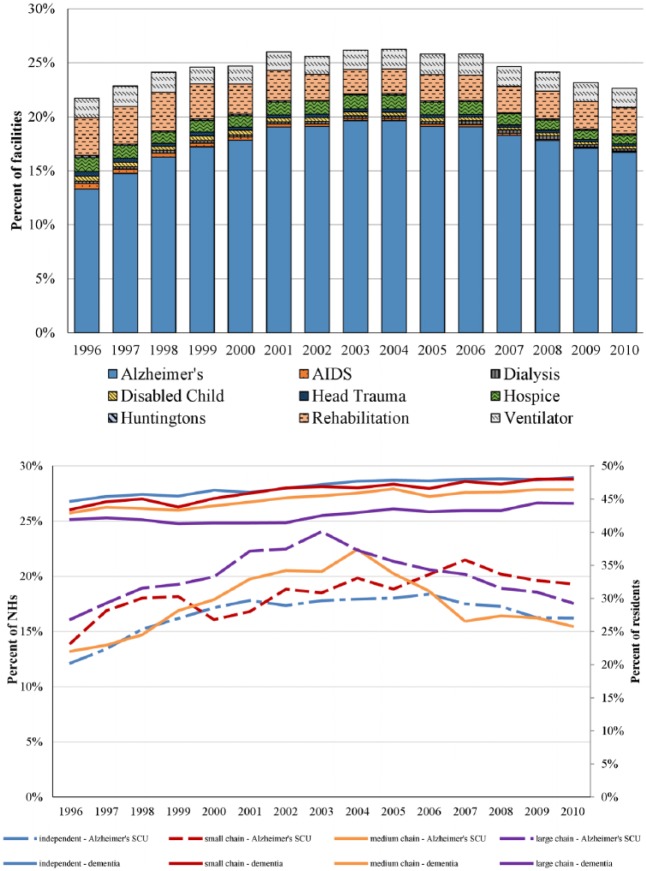
Figure 1.
Description.
Source. Authors’ analysis of Online Survey Certification and Reporting (OSCAR) data.
Note. Trends in SCUs over time. The top panel shows the percentage of NHs with SCUs by type. The lower panel shows the percentage of Alzheimer disease SCUs by chain-affiliation size (small 5-10 NHs, medium 11-29 NHs, and large ≥30 NHs) and percentage of dementia residents in the NH on the secondary axis. SCUs = specialty care units; NHs = nursing homes.

