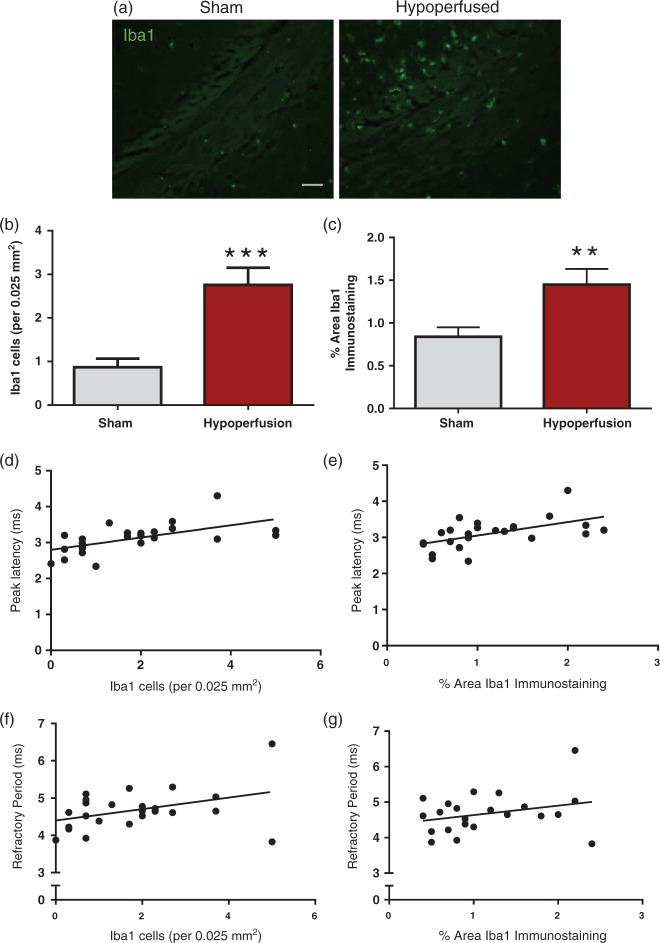
Figure 3.
Elevated microglia/macrophage number and density in response to severe chronic hypoperfusion. (a) Confocal images from the corpus callosum of animals immunostained with Iba1 (green), scale bar: 50 µm. (b) There was a significant increase in microglial numbers following hypoperfusion (***p = 0.0003). (c) There was a significant increase in % area of Iba1 immunostaining following hypoperfusion (**p = 0.009). (d) There was a significant positive correlation between numbers of microglia and slowing of peak latency (r = 0.59, p = 0.002). (e) There was a signification positive correlation between % area of Iba1 immunostaining and peak latency (r = 0.55, p = 0.006). (f) There was no significant association between microglial numbers and slowing of axonal refractory period (r = 0.4, p = 0.06) (g) and no association between % area of Iba1 immunostaining and peak latency (r = 0.29, p = 0.17). Data are presented as mean ± S.E.M. Student’s t test, *p < 0.05 **p < 0.01, ***p < 0.001; n = 12 per group.

