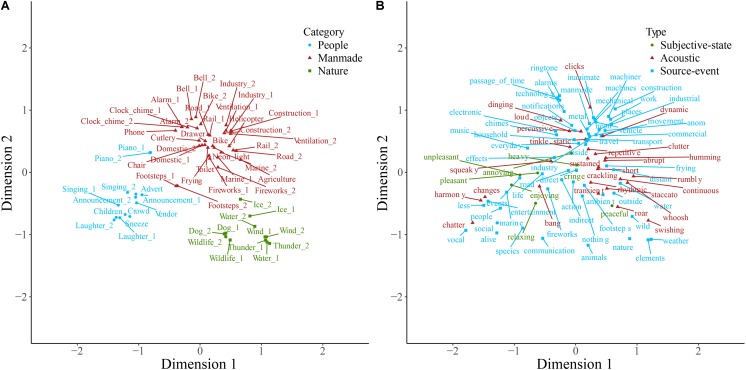
FIGURE 1.
Soundscape sounds (A) and descriptive words (B) plotted on the first two dimensions of categorization data. Note that the dimensions are the same in both panels. Sounds (A) are colored according to which of the main categories they belong to, and descriptive words (B) are colored according to type. Labels are displaced from their corresponding data point, indicated by a connecting line, to avoid overlapping.

