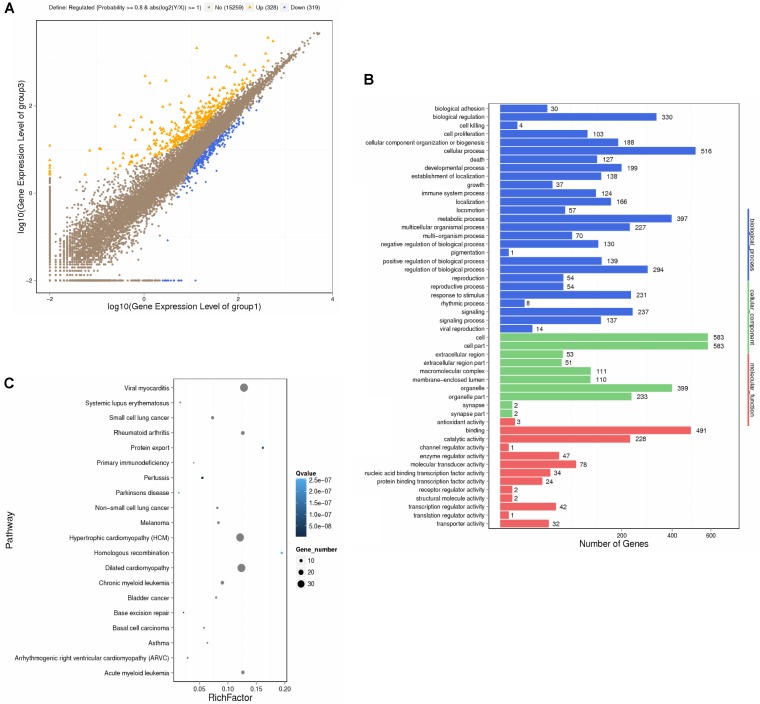
FIGURE 3.
Transcriptional profiling and bioinformatic analysis of cardiomyocytes in mice. The screening and identification of differential genes were performed between QX1 treated group (high dose, 1 g/kg⋅bw) and CLP surgery group (48 h). (A) Scatter plots of genes in each pairwise. X- axis and Y- axis both present the log2 value of all gene expression. Blue spots indicate down-regulation genes (p < 0.05), orange spots indicate up-regulation genes (p < 0.05), and brown spots indicate non-regulation genes (p > 0.05). (B) Gene ontology (GO) analysis of differential genes. WEGO software were employed to perform GO functional classifications, including biological process, cellular component, and molecular function. (C) Pathway enrichment analysis of differential genes. The KEGG database was employed to perform pathway enrichment analysis. Pathways with Q ≤ 0.05 were identified as enriched pathways.

