
FIGURE 1.
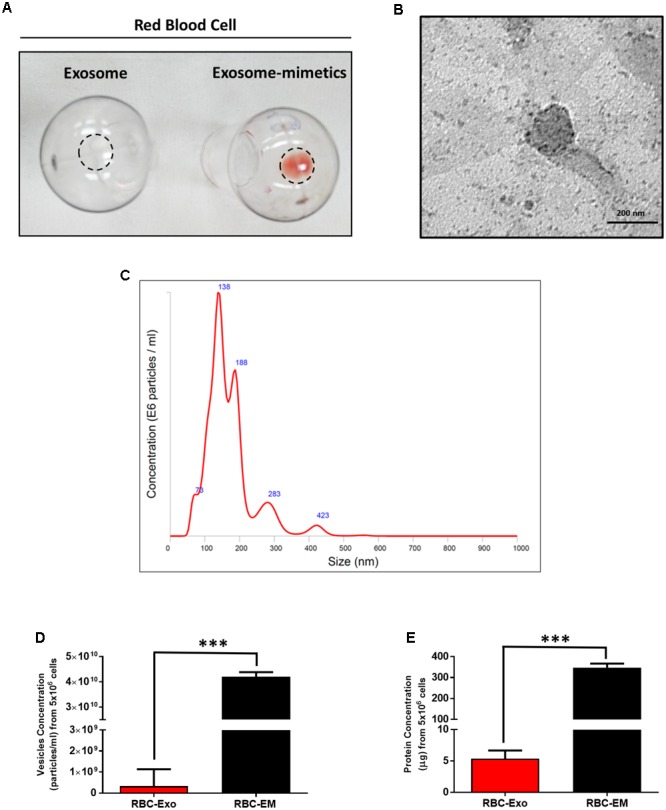
Characterization of RBC-EMs and RBC-Exos, and comparison of their vesicular yields (A) Representative images of RBC-Exos and RBC-EMs isolated from the same number of RBCs. (B) Morphology of RBC-EMs and 99mTc-RBC-EMs was examined by TEM. (C) Nanoparticle tracking analysis of RBC-Exos. (D) The yields of RBC-Exos and RBC-EMs measured as particle numbers (n = 3). (E) RBC-Exos and RBC-EMs total protein content (n = 3). The values are expressed as mean ± SD, ∗∗∗P < 0.001, (Student’s t-test).