
FIGURE 4.
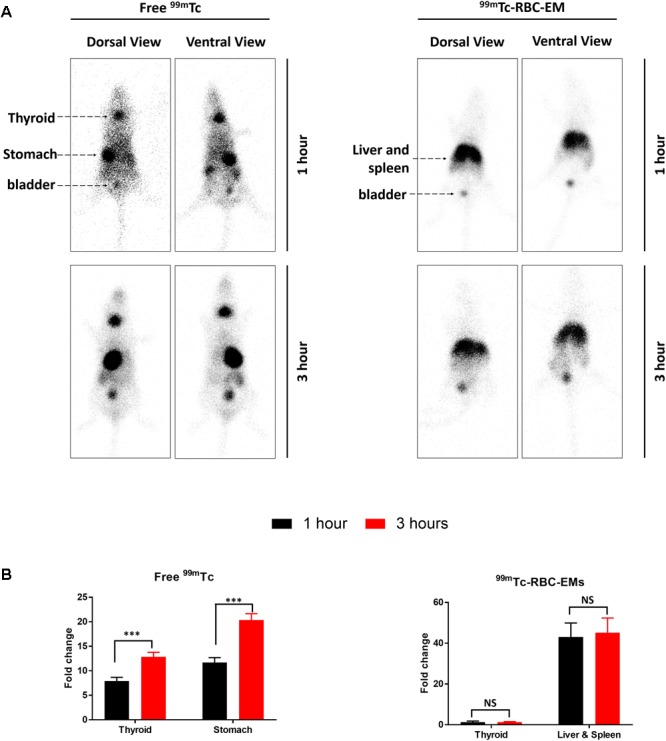
In vivo gamma camera images of free 99mTc and 99mTc-RBC-EMs injected in mice. (A) After the intravenous injection of free 99mTc and 99mTc-RBC-EMs, gamma camera images were acquired at 1 and 3 h post-injection in C57BL/6 mice (n = 4). (B) Quantification of 99mTc and 99mTc-RBC-EMs injected mice organ (thyroid, stomach, liver, and spleen) was performed and represented as bar graph. The values are expressed as mean ± SD, ∗∗∗P < 0.001 (Student’s t-test).