
FIGURE 7.
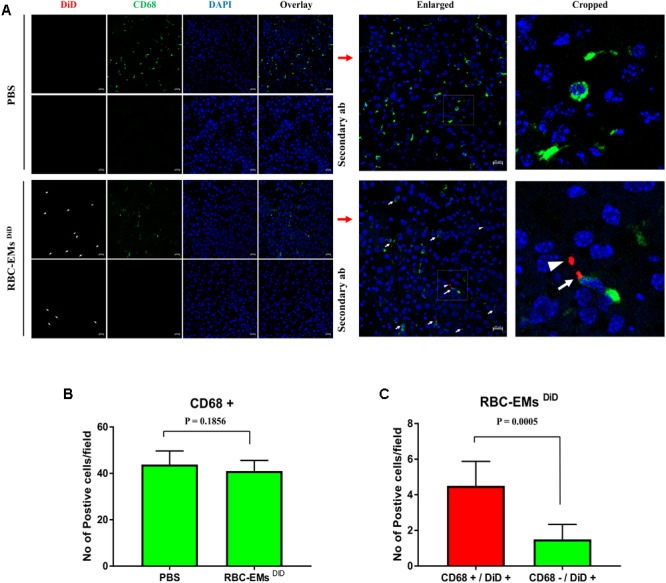
Sub-cellular visualization of RBC-EMs DiD in mice liver. (A) Representative confocal images of RBC-EMsDiD (red) and CD68 (green) in liver harvested from the mouse mentioned in. Arrow indicating CD68 + and DiD +; arrow head indicating CD68 – and DiD +Scale bars: 20 μm. (B) Quantification of CD68 cells from confocal images of liver from PBS and RBC-EMsDiD injected mice was counted and represented in bar graph. (C) Quantification of confocal images of RBC-EMsDiD (red) with or without CD68 (green) in liver harvested from the mouse was counted and represented in bar graph. The values are expressed as mean ± SD (Student’s t-test was used).