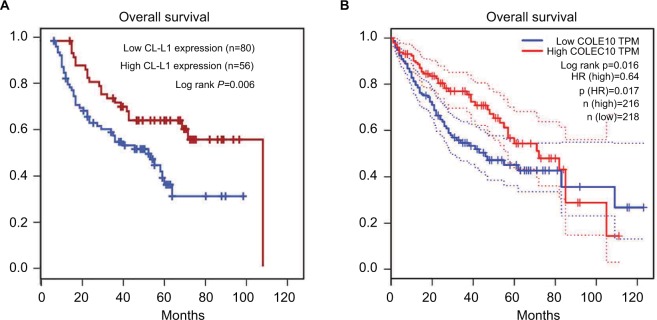
Figure 2.
(A) Kaplan–Meier analysis of the relationship between overall survival and CL-L1 expression, (B) the prognostic effect of the COLEC10 mRNA level in HCC from GEPIA database.
Notes: n(high): Samples with expression level higher than the median of TPM (transcripts of per million) are considered as the high-expression cohort. n(low): Samples with expression level lower than the median of TPM are considered the low-expression cohort.
Abbreviations: COLEC10, collectin subfamily member 10; GEPIA, Gene Expression Profiling Interactive Analysis; HCC, hepatocellular carcinoma; HR, hazard ratio; TPM, transcripts per million.

