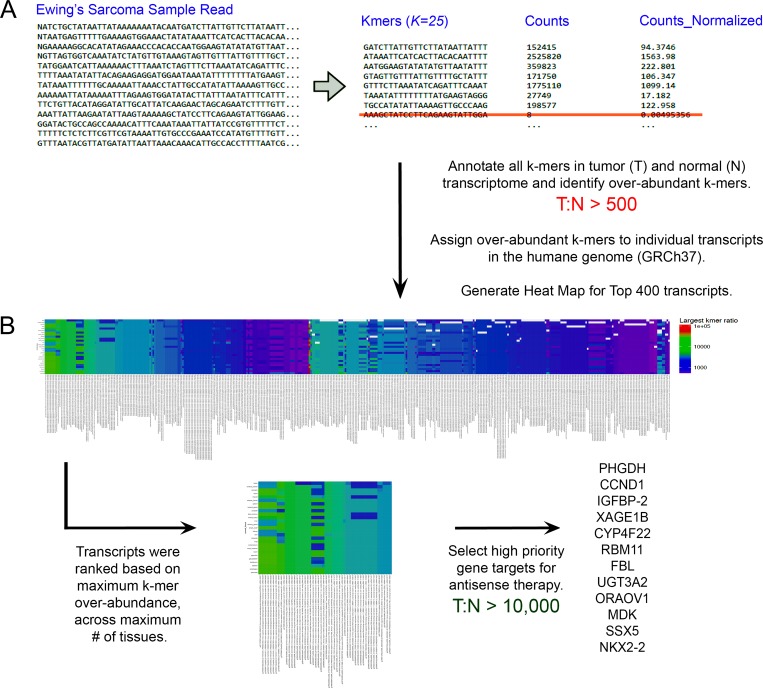
Figure 2. Overview of the k-mer based computational counting approach.
(A) RNA-Seq produces short sequencing reads (∼ 100 bp) from total or poly-A RNA and we can rapidly count all instances of any given ribonucleotide string (length = k) within that dataset. Here we demonstrate the total counts of all, individual 25-mer RNA strand sequences present in an RNA-Seq database for EWS cells, normalized to the total number of sequencing reads for the experiment. 25-mers found to be highly-abundant in EWS cells, with tumor (T) to normal (N) ratios (T:N) greater than 500 were assigned to individual protein coding or non-coding RNA transcripts found in the human genome (GRCh37; hg19). Next, the top 400 transcripts were plotted in a heat map visualizing, for each tissue/transcript combination, the abundance ratio for the selected k-mer across 26 tissues. EWS-specific gene transcripts with k-mer over-abundance levels exceeding 1000-fold over normal cells are colored blue, while those with levels 10,000-fold to 100,000-fold above normal tissues are colored from green to red, respectively. (B) Exceptional transcripts identified as having the maximum k-mer over-abundance across the maximum number of tissues were down-selected as high priority leads for antisense inhibition studies. We identified 12 EWS-specific gene targets from regions of the heat map where the T:N ratio approached or exceeded 10,000:1 across all 26 tissues. EFT-specific genes identified include: PHGDH, CCND1, IGFBP-2, XAGE1B/E, CYP4F22, RBM11, FBL, UGT3A2, ORAOV1, MDK, SSX5 and NKX2-2. 6 of the most exceptional genes with unique cellular functions (listed in Table 2) were selected for further analysis using our reverse genetics approach.

