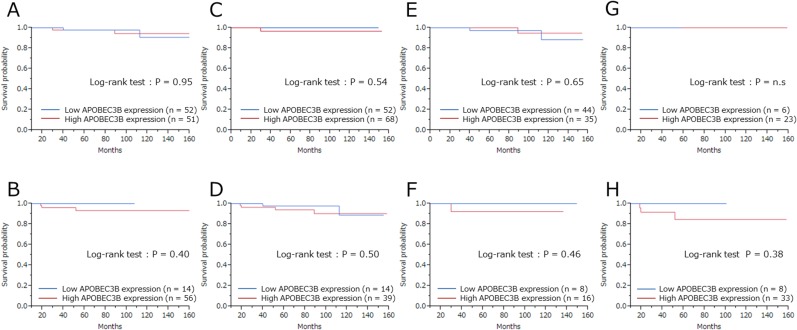
Figure 4. Breast cancer–specific survival (BCSS) according to APOBEC3B mRNA expression among the different subtypes.
Kaplan-Meier plots showing the association of APOBEC3B mRNA expression with BCSS. (A) ER+ cases, (B) ER- cases, (C) HER2+ cases, (D) HER2- cases, (E) Luminal (ER+ and/or PgR+, HER2-) cases, (F) Luminal-HER2 (ER+ and/or PgR+, HER2+), (G) HER2-enriched (ER- and PgR-, HER2+), (H) triple-negative (ER-, PgR- and HER2-) cases.

