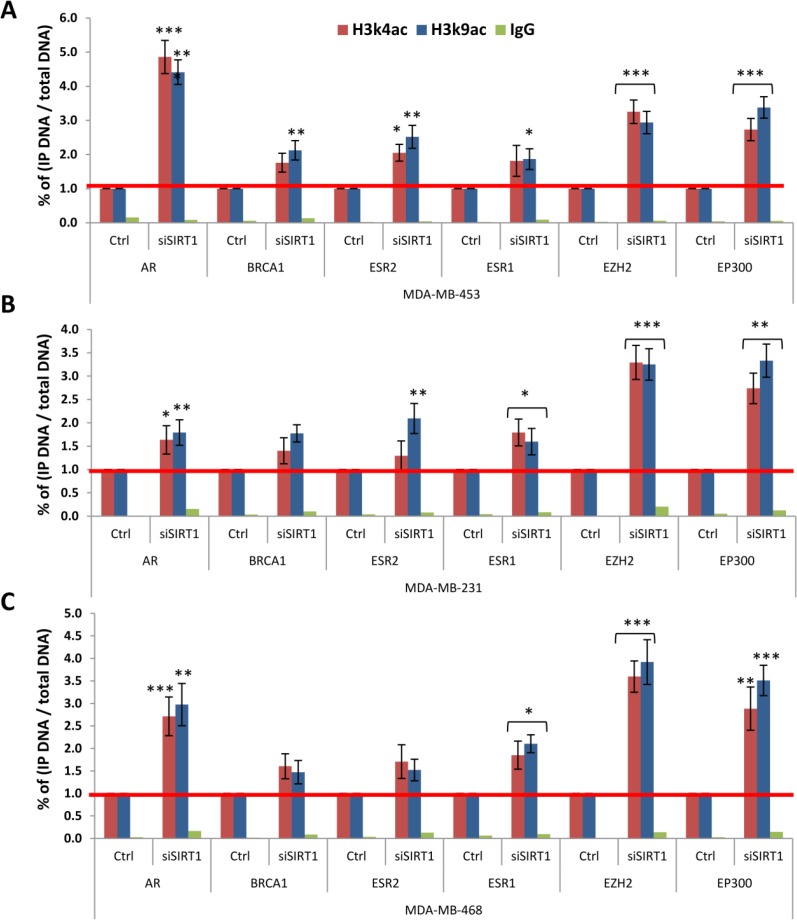
Figure 10. Impact of SIRT1 knockdown on the enrichment of H3k4ac and H3k9ac at targeted gene panel promoters in TNBC subtype cell lines.
Transfected (siSIRT1) and non-transfected (Ctrl) MDA-MB 453 (A), MDA-MB 231 (B) and MDA-MB 468 (C) cell lines were subjected to direct ChIP assays using anti-H3k4ac Ab, anti-H3k9ac Ab and non-immune IgG Ab serving as negative control. The efficiency of ChIP was calculated by real time q-PCR on promoters of 6 targeted genes: AR, BRCA1, ERS2, ERS1, EZH2 and EP300. All data are presented as fold enrichment of transfected over control cell lines (set as 1). The y-axis represents the percentage of (IP DNA/Total DNA) on target genes promoters. Each column represents the mean ± SD of 3 replicate experiments. P values were two-tailed, *P < 0.05, **P < 0.01 and ***P < 0.001 were considered statistically significant.

