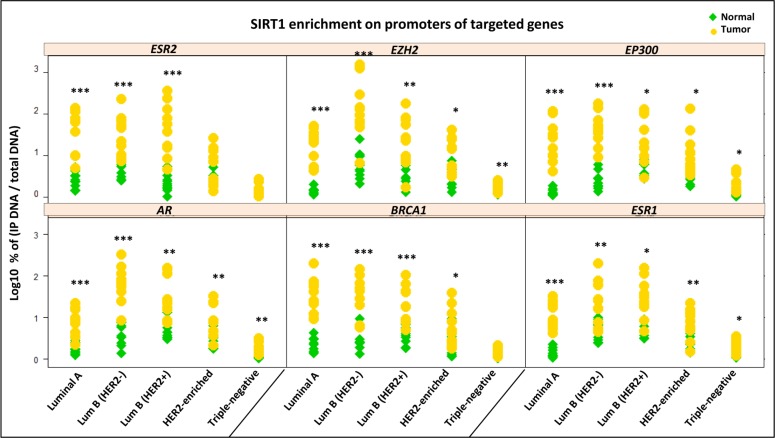
Figure 2. SIRT1 enrichment on promoters of 6 breast cancer-related genes in the 5 molecular breast tumor subtypes versus matched normal tissues.
Column scatter plot showing the results of ChIP assays using anti-SIRT1 Ab on 50 breast tumors and their 50 matched normal tissues: n = 10 tumors for each of the 5 molecular subtypes. The efficiency of ChIP was calculated by real time quantitative PCR using the primers and probes of 6 targeted genes: AR, BRCA1, ERS1, ERS2, EZH2 and EP300. The y-axis represents the log expression percent of (IP DNA/Total DNA) on target genes promoters. Statistically significant difference of SIRT1 enrichment in tumors versus normal tissues was analyzed by Student’s t-test. P values were two-tailed, *P < 0.05, **P <0.01 and ***P < 0.001 were considered statistically significant.

