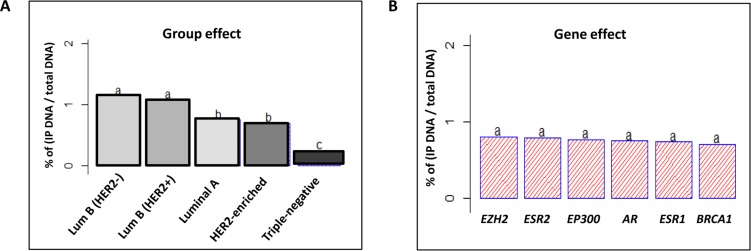
Figure 3. Tukey’s post-hoc comparison of the means analyzing Group and Gene effects.
ANOVA test followed by Tukey’s multiple comparison test were performed on the results of 50 ChIP assays analyzed by q-PCR (A) The statistical analysis discerned 3 different SIRT1 enrichment patterns depending on tumor molecular subtype (Group effect). (B) Insignificant discrimination of SIRT1 enrichment in relation to variable gene types (Gene effect). The letters ‘a’, ‘b’ and ‘c’ indicate statistical significance between groups.

