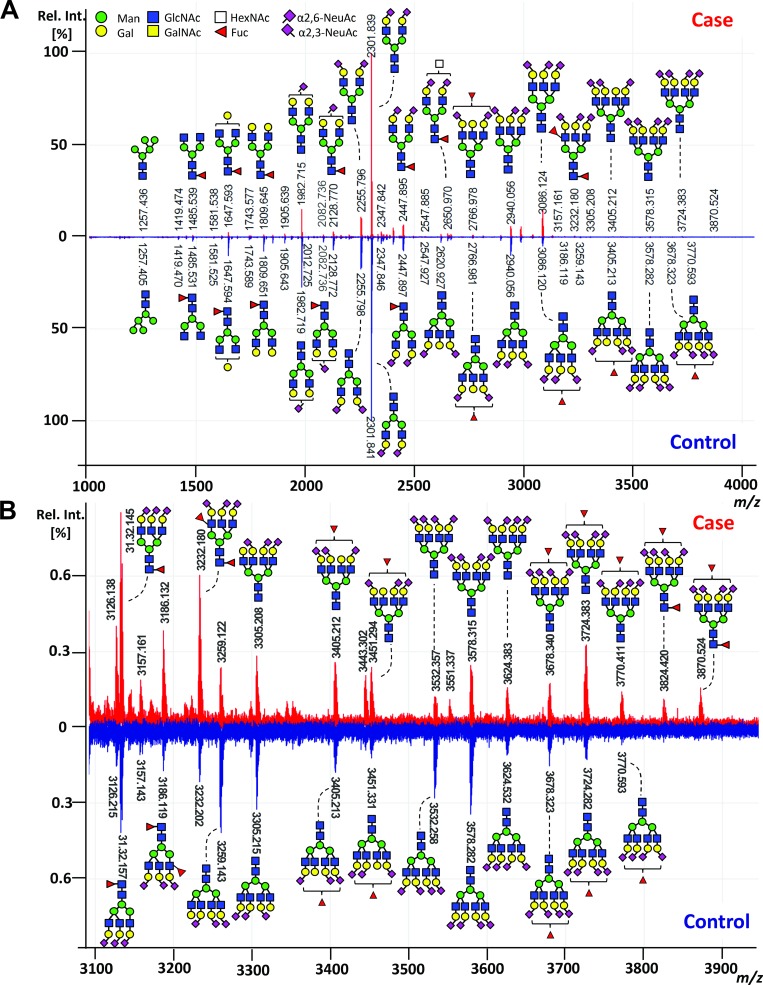
Figure 2. Exemplary MALDI-TOF-MS spectra of the total serum N-glycome comparing case and control.
(A) MALDI-TOF-MS spectrum of a case (red) and its matched control (blue) with (B) zoom in the higher m/z range (m/z 3100 to m/z 3900). Spectra were recorded in positive ion reflectron mode on a Bruker UltrafleXtreme mass spectrometer. Main peaks were annotated with glycan cartoons reflecting compositions, thereby the presence of structural isomers cannot be excluded. Green circle = mannose, Man; yellow circle = galactose, Gal; blue square = N-acetylglucosamine, GlcNAc; white square = N-acetylhexosamine, HexNAc; red triangle = fucose, Fuc; purple diamond = sialic acid, N-acetylneuraminic acid, NeuAc. Differences in N-acetylneuraminic acid linkages are indicated using angles.

