
FIGURE 6.
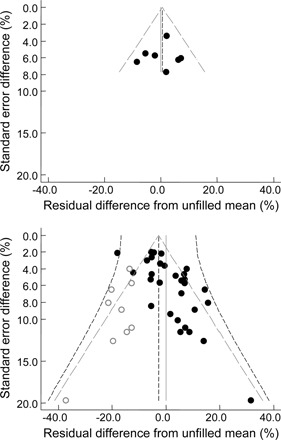
Symmetry and asymmetry in study residual differences from trends. Residuals are differences between individual study results and the corresponding trend shown in Figure 3. The upper panel shows studies with authorship from only scientists in food companies (k = 7, symmetrical without heterogeneity) and from all other studies including academic and clinical authors (k = 30, asymmetrical with heterogeneity). Symbols are for individual study means (•) with the addition of nonparametric estimates (○) generated by trim-and-fill analysis to make the distribution symmetrical or to represent missing studies (if assumed to be publication bias). The sloping lines show pseudo 95% CIs (see Methods) for the fixed effect (gray – – –) and the random effect (black - - -). The vertical lines show the null difference from trend at  = 0 (gray – – –) and the combined residual mean () at the center of the fixed or random filled distributions (black - - -), which in the lower panel shows a nonsignificant difference for of −2.8 SE 1.5% (P > |z| = 0.07).