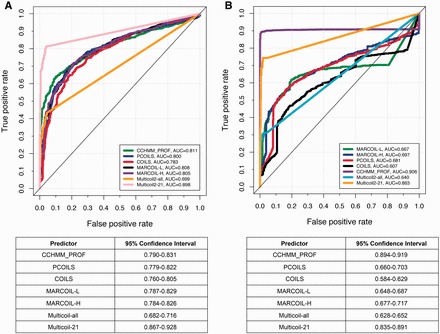
Figure 5.

Performance comparison of CCD predictors. (A) ROC curves and the 95% confidence intervals of different predictors for identifying coiled-coil domains. (B) ROC curves and the 95% confidence intervals of different predictors, showing the consistency between the predicted CCDs and those annotated by SOCKET based on the protein structures. A colour version of this figure is available at BIB online: http://bib.oxfordjournals.org.
