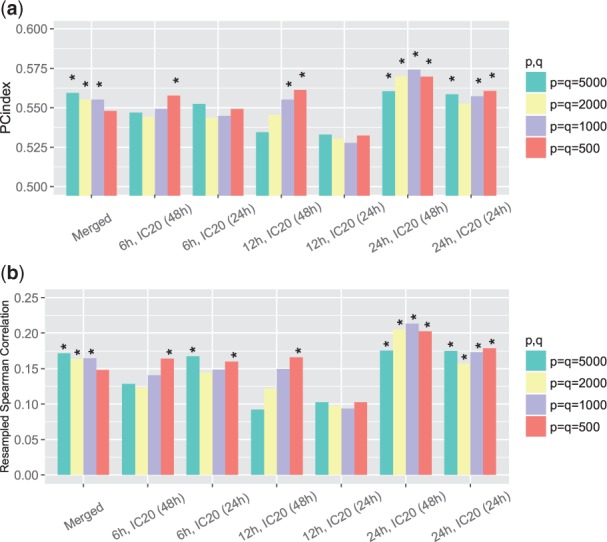
Fig. 3.

(a) PC-indices of GSEA-based gene expression similarity scores. (b) Resampled Spearman correlations of GSEA-based gene expression similarity scores. When calculating the similarity scores, we considered different numbers of top () and bottom () signatures; we included the results for a merged data set and six unmerged data sets separately. *P-value <; **P-value <
