
Fig. 4.
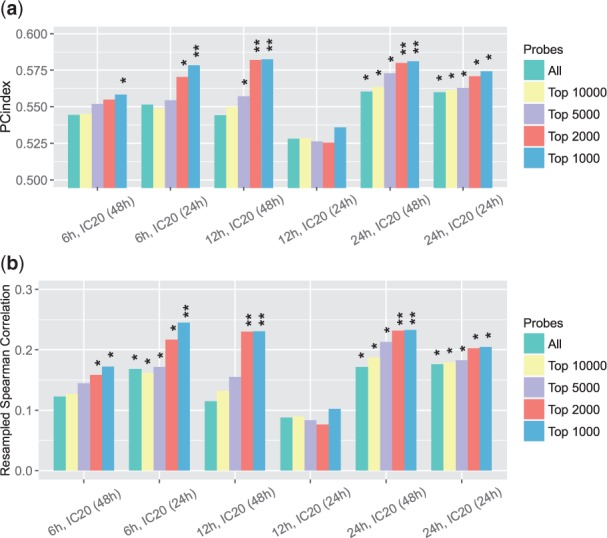
(a) PC-indices of Pearson correlation-based gene expression similarity scores. (b) Resampled Spearman correlations of Pearson correlation-based gene expression similarity scores. When calculating the similarity scores, we considered all probes as well as probes with largest expression changes only. *P-value <; **P-value <0.01