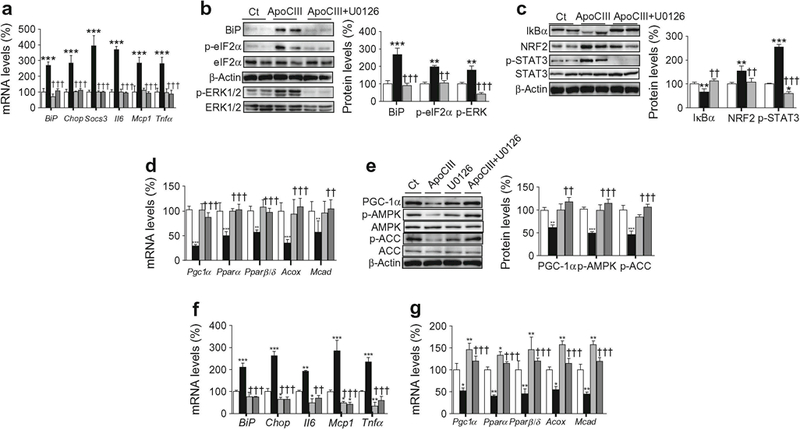
Fig. 6.

ERK1/2 inhibition prevents the effects of apoCIII on ER stress and inflammation. (a–e) C2C12 myotubes were incubated in the presence (black bars) or absence (control, Ct, white bars) of 100 μg/ml apoCIII for 24 h; 10 μmol/l U0126 was added to control myotubes (light grey bars) or apoCIII-treated myotubes (dark grey bars). (a) mRNA abundance of Bip, Chop, Socs3, Il6, Mcp1 and Tnfα. (b) BiP, phospho-eIF2α (Ser51), phospho-ERK1/2 (Thr202/Tyr204) and β-actin protein levels. (c) IκBα, NRF2, phospho-STAT3 (Tyr705) and β-actin protein levels. (d) mRNA abundance of Pgc1α, Pparα, Pparβ/δ, Acox and Mcad. (e) PGC-1α, phospho-AMPK (Thr172), phospho-ACC (Ser79) and β-actin protein levels. (f, g) C2C12 myotubes were transfected with control or ERK1/2 siRNA and incubated in the presence or absence of 100 μg/ml apoCIII for 24 h. The mRNA abundance of Bip, Chop, Il6, Mcp1 and Tnfα (f) and Pgc-1α, Pparα, Pparβ/δ, Acox and Mcad (g) was evaluated. White bars, control siRNA; light grey bars ERK1/2 siRNA; black bars, apoCIII+ control siRNA; dark grey bars, apoCIII+ERK1/2 siRNA The graphs show quantification expressed as a percentage of control. Data are means ± SD of five independent experiments and were compared by two-way ANOVA followed by Tukey post hoc test. *p < 0.05, **p < 0.01 and ***p < 0.001 vs control; ††p < 0.01 and †††p < 0.001 vs apoCIII-exposed cells
