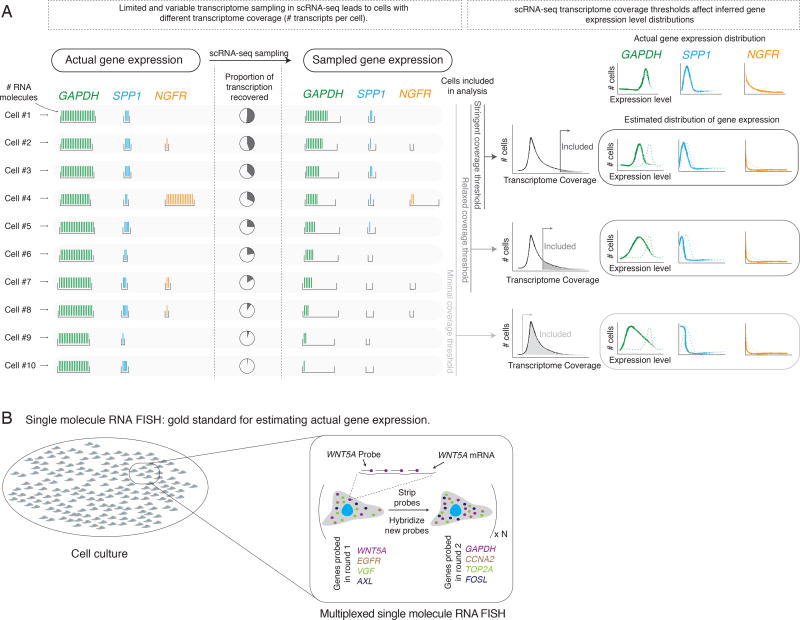
Figure 1. Technical sampling in single cell RNA sequencing can qualitatively change gene expression distributions.
(A) Single cell RNA sequencing (scRNA-seq) subsamples the actual transcriptome (left) to an observed transcriptome (middle). Different cells (horizontal rows) can have different degrees of transcriptome coverage. Depending on the number of cells analyzed, the observed expression distribution for any particular gene may not reflect the true distribution (right). We schematically depicted three classes of genes: high, minimally variable expression (GAPDH); low, minimally variable expression (SPP1); rare cells with high expression (NGFR). (B) Multiplexed single molecule RNA FISH is the gold standard for estimating gene expression at the single cell level. In each round of hybridization, we probe four genes, each with a set of DNA probes containing a common fluorophore. After imaging the resulting RNA spots, we strip the probes, and hybridize a new set of probes.

