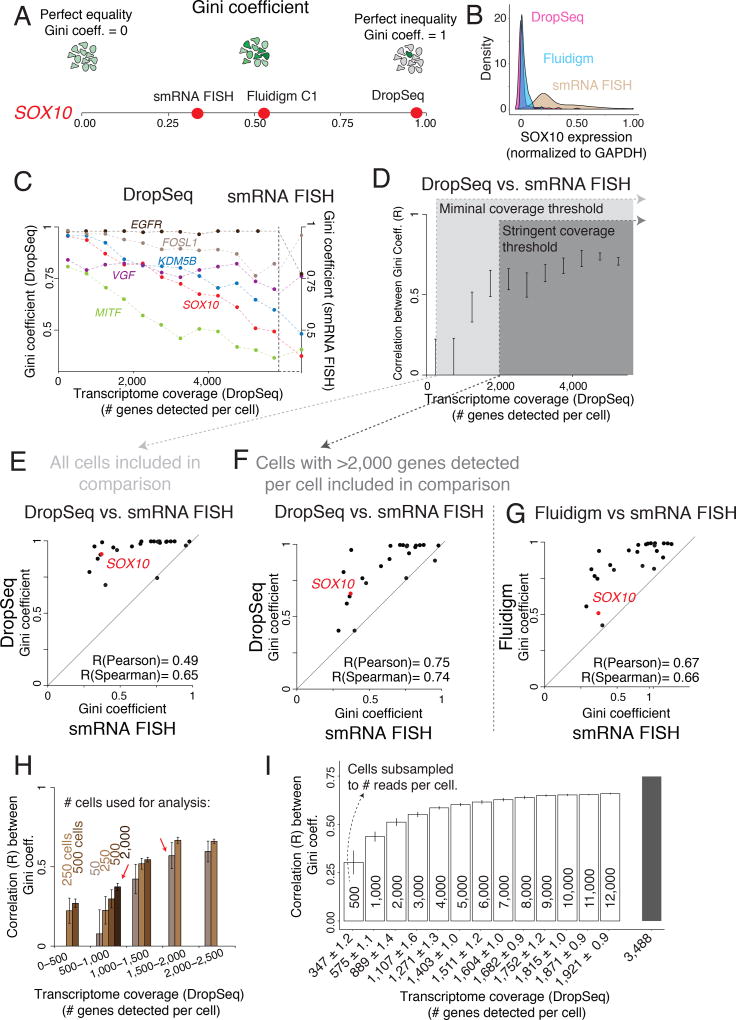
Figure 3. Estimates of gene expression heterogeneity in single cell RNA sequencing are highly dependent on transcriptome coverage.
(A) The Gini coefficient measures a gene’s expression distribution and captures rare cell population heterogeneity. (B) Population structure of SOX10 mRNA levels measured by DropSeq (pink), Fluidigm (blue), and single molecule RNA FISH (smRNA FISH, brown). (C) Gini coefficient for six genes measured by DropSeq (left y-axis) binned by levels of transcriptome coverage as well as Gini coefficients measured by smRNA FISH (right y-axis). (D) Pearson correlation between Gini coefficients measured through DropSeq and smRNA FISH across different levels of transcriptome coverage (# genes detected per cell). Error bars represent ± 1 standard deviation across bootstrap replicates. (E,F) Scatter Plot of the correspondence between Gini coefficients for 26 genes measured by both DropSeq and smRNA FISH. (G) Scatter Plot of the correspondence between Gini coefficients for 26 genes measured by Fluidigm and smRNA FISH. (H) Pearson correlation between Gini coefficient estimates measured by DropSeq and smRNA FISH using different population sizes (# of cells) and levels of transcriptome coverage. Error bars represent ± 1 standard deviation across bootstrap replicates. (I) Pearson correlation between Gini coefficient estimates measured by DropSeq and smRNA FISH after subsampling cells with high transcriptome coverage to different degrees of reads depth. Numbers inside the bars represent the number of reads subsampled. The x-axis represents the average number of genes detected across all cells at a given subsample depth. Error bars represent ± 1 standard deviation across bootstrap replicates.

