
Figure 4. Calibration of chemical potential Δμ for two different water models (TIP3P and TIP4P-Ew) and NCMC protocol optimization.
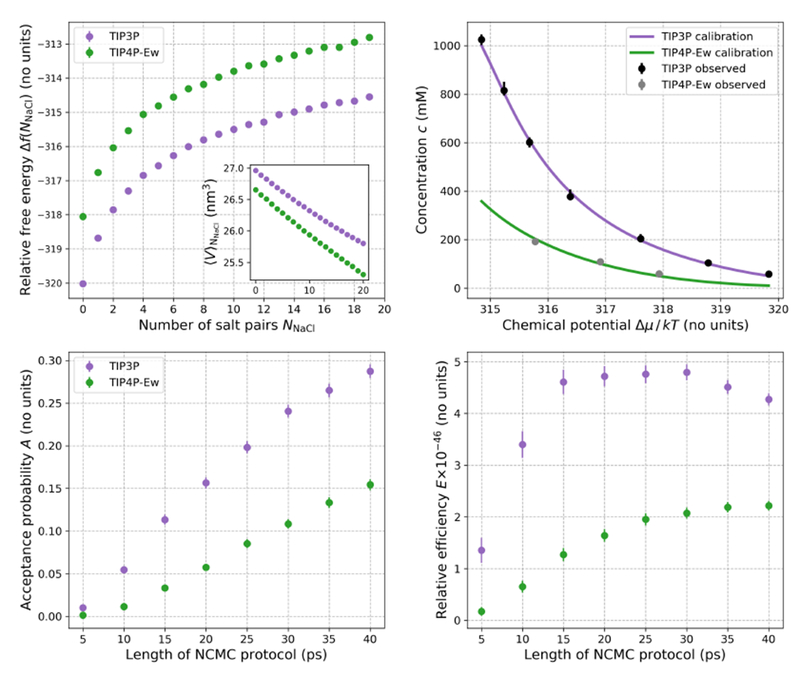
Top left, main: The relative free energy Δf(NNaCl)—estimated from the SAMS calibration simulations—to insert an Na+ and Cl− salt pair and remove two water molecules in boxes of TIP3P and TIP4P-Ew water as a function of the number of salt pairs NNaCl already present in the box (see equation 16). Top left, inset: The average volume of the saline box as a function of NNaCl, estimated from the SAMS calibration simulations. The TIP3P box contained a total of 887 molecules (including water and ions) and the TIP4P-Ew box contained 886 molecules. The relative free energies and 95% confidence intervals have been calculated using BAR and are smaller than the circular markers. Top right: Predicted relationship between the macroscopic salt concentration and chemical potential difference Δμ estimated with equation 19 for TIP3P and TIP4P-Ew (dark lines) compared to the average concentrations 〈c〉 estimated from equilibrium osmostat simulations of boxes of water at specified chemical potentials (circles). There were 4085 and 4066 molecules in the boxes ofTIP3P and TIP4P-Ew water, respectively. Bootstrapping of BAR uncertainty estimates of f(NNaCl) and bootstrap uncertainties of were used to calculate 95% confidence intervals for the mean concentration curves—these fall inside the thick lines. Error bars on the average simulation concentrations show 95% confidence intervals, and have been estimated using bootstrap sampling of statistically independent subsamples of the simulation concentrations. For the osmostat simulations, equilibration times were automatically estimated and independent samples extracted using the timeseries module of pymbar 75. For these osmostat simulations, the shortest and largest estimated equilibration times were 0.2 ns and 26.9 ns respectively, with the largest equilibration time occurring for TIP3P simulation at the lowest Δμ—the staring salt concentration for this simulation was furthest from the equilibrium value. Bottom left: Average acceptance probability for salt insertion and deletion as a function of the NCMC protocol length. Simulations were run with a 200 mM osmostat in boxes of TIP3P (887 molecules) and TIP4P-Ew (886 molecules). The mean instantaneous MC acceptance probabilities for TIP3P and TIP4P-Ew are very small: 3.0 × 10−51 [5.0 × 10−66, 9.0 × 10−51] and 1.0 × 10−46 [3.0 × 10−64, 4.0 × 10−46] respectively, (with 95% confidence intervals denoted in brackets). Bottom right: The efficiency (defined by equation 25) of the NCMC protocols relative to instantaneous insertion and deletion attempts in TIP3P for a 200 mM osmostat; all protocols are at least 1045 times more efficient than instantaneous insertion and deletion. NCMC protocols of about 20 ps for TIP3P are optimal for our nonequilibrium procedure, though longer protocols are required to achieve similar efficiencies for TIP4P-Ew.