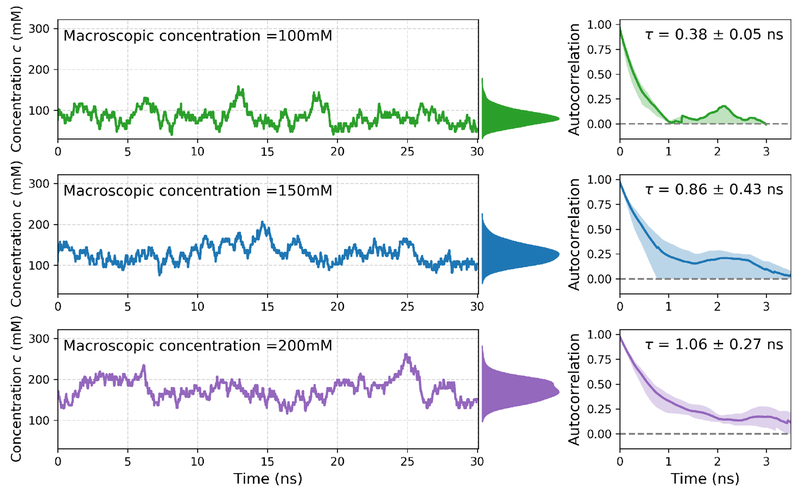
Figure 5. Dynamic salt sampling for DHFR in TIP3P water at three macroscopic salt concentrations.
Left: Trajectories of the salt concentration in 30 ns simulations of DHFR in a boxes of TIP3P waters as a function of time for 100 mM, 150 mM, and 200 mM NaCl, along with distribution of equilibrium salt concentrations to right of the time-series plots. The distributions were estimated using a Gaussian smoothing kernel with bandwidth of 0.3 mM from all three simulation repeats at each macroscopic concentration. Before the insertion of NaCl, the simulation contained 7023 water molecules. Right: Normalized fluctuation autocorrelation functions and integrated autocorrelation times (τ) of salt concentrations for each simulation. Shaded regions and uncertainties on the autocorrelation time signify 95% confidence intervals calculated using bootstrap estimation from three independent simulations.

