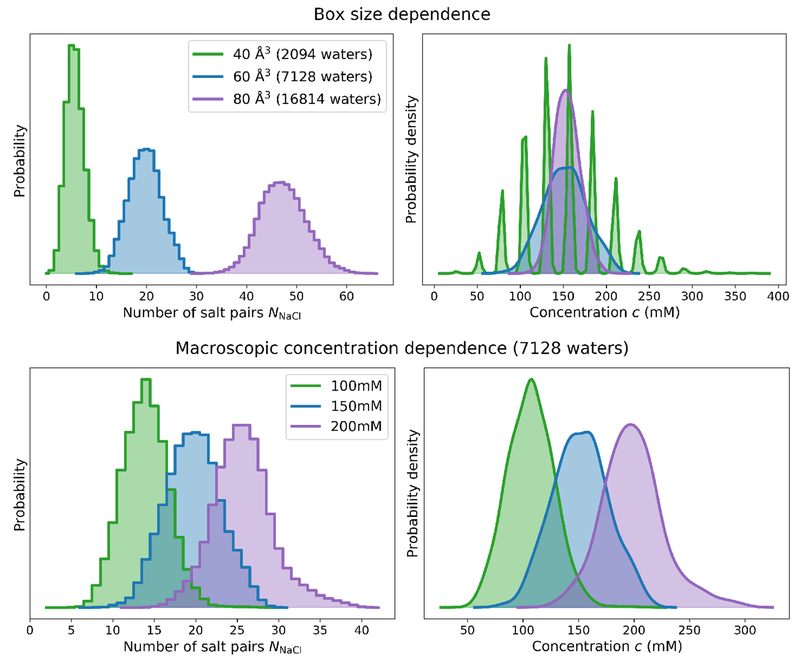
Figure 6. Distribution of salt numbers and concentrations for TIP3P water boxes of varying size and macroscopic salt concentration.
Top: Equilibrium distribution of salt numbers (NNaCl, left) and salt concentrations (c, right) as a function of the number of water molecules in the simulation. The applied macroscopic concentration was 150mM. blue As expected (see Appendix 2), at fixed macroscopic salt concentration, the magnitude of fluctuations in the number of salt pairs NNaCl grows with box size (left), whereas the magnitude in the concentration decreases with box size. The average salt concentration 〈c〉 remains fixed at the specified macroscopic concentration (right) showing that the calibrated chemical potential Δμ is invariant to box size provided the calibration box is selected to be sufficiently large to avoid finite-size effects. The small range of NNaCl in the 40 Å box results in a multimodal salt concentration distribution. Bottom: Equilibrium distribution of salt numbers (NNaCl, left) and salt concentrations (c, right) as a function of salt concentration for a water box containing 7128 waters.

