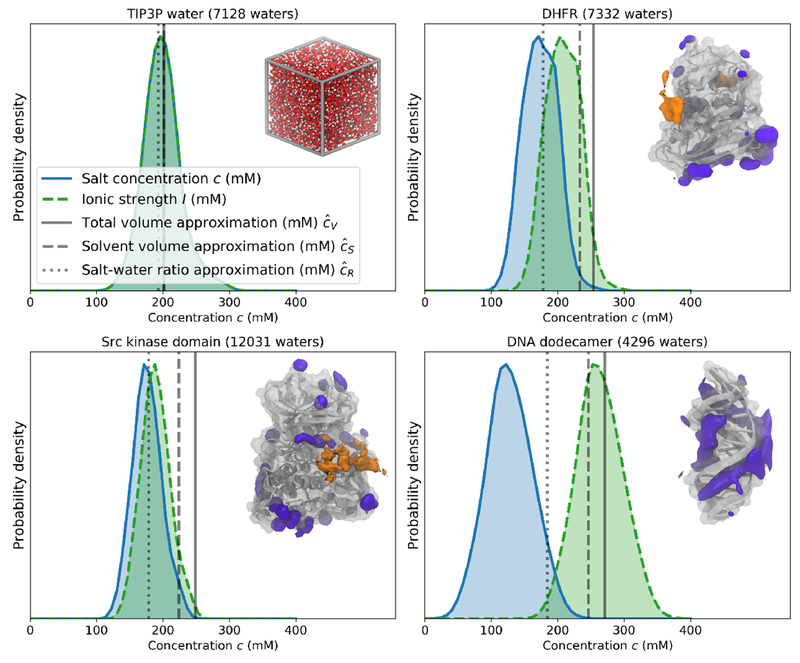
Figure 7. Equilibrium salt concentration distributions for various biomolecular systems simulated with a 200 mM osmostat.
Equilibrium salt concentration distributions (blue shaded area) are shown as a kernel density estimate of the probability density, along with the ionic strength of the solvent (light green shaded area with dotted lines). No samples of the salt concentration were discarded for these density estimates. For reference, the mean salt concentrations that would be achieved in three typical fixed-salt salination strategies are shown in transparent gray lines. The continuous line uses equation 22 and the total volume of first frame of the production simulation; the dashed line uses equation 23 and the volume of solvent at the start of the production simulation, and the dotted line uses equation 24 and the ratio of the number of salt pairs and water molecules. Illustrations of each system are also shown in the top right of each plot, with Na+ (purple) and Cl− (orange) densities from equilibrium 200 mM osmostat simulations shown around the three macromolecules. Isovalues for the each of 3D ion densities were chosen for visual clarity. Upper left: Box of TIP3P waters; Upper right: DHFR (dihydrofolate reductase) in TIP3P with isosurfaces containing 14.3% and 0.8% of Na+ and Cl− densities, respectively; Lower left: apo Src kinase in TIP3P with isosurfaces containing 8.5% and 0.6% of the Na+ and Cl− densities, respectively; Lower right: Drew-Dickerson DNA dodecamer in TIP3P with 8.9% of the Na+ density contained in the isosurface.

