
Figure 8. Dependence of the charge screening length and salt concentration on simulation size for the Drew-Dickerson DNA dodecamer.
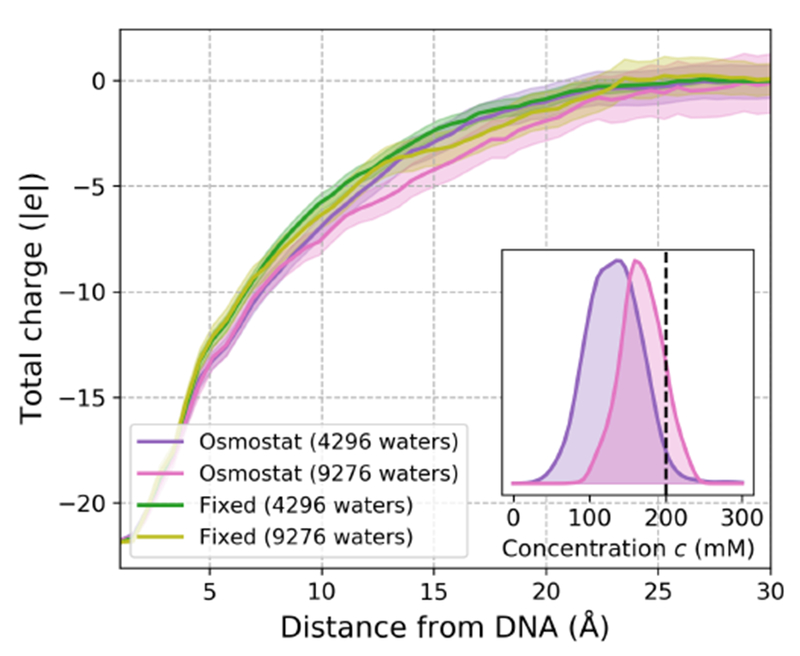
Main: The mean total charge within a minimum distance from the Drew-Dickerson DNA dodecamer for 200 mM NaCl osmostated simulations and 200 mM fixed salt fraction simulations. To compare the effect of solvent content on charge screening effects, the DNA dodecamer was solvated in water boxes of two different sizes. The smallest system had water added up to a distance no less than 9 Å away from the DNA dodecamer (adding 4296 waters), whereas the larger was solvated up to a distance at least as large as 16 Å (adding 9276 waters). As each simulation is electrostatically neutral, the total charge must decay to zero as the distance from the DNA dodecamer increases, but the rate at which this decay occurs provides insight into the lengthscales for which biomolecules accrete a neutralizing ion constellation. The charge distributions appear robust with respect to the size of the simulation cell, as all 95% confidence intervals (transparent colors) of the mean charge-distance profiles overlap over all distances considered. The charge-distance profiles were estimated by counting the number of ions within fixed distances of the DNA dodecamer every 1 ns and the confidence intervals were estimated by using boostrap sampling. Inset: Salt concentration probability densities estimated using kernel density estimation for 200 mM osmostated simulations with different amounts of solvent. The simulation with the small solvent box (purple) recruits far fewer salt pairs from bulk on average (dotted black line denotes 200 mM), while the average salt concentration of the simulation with the larger solvent box (pink) is significantly less perturbed from bulk.