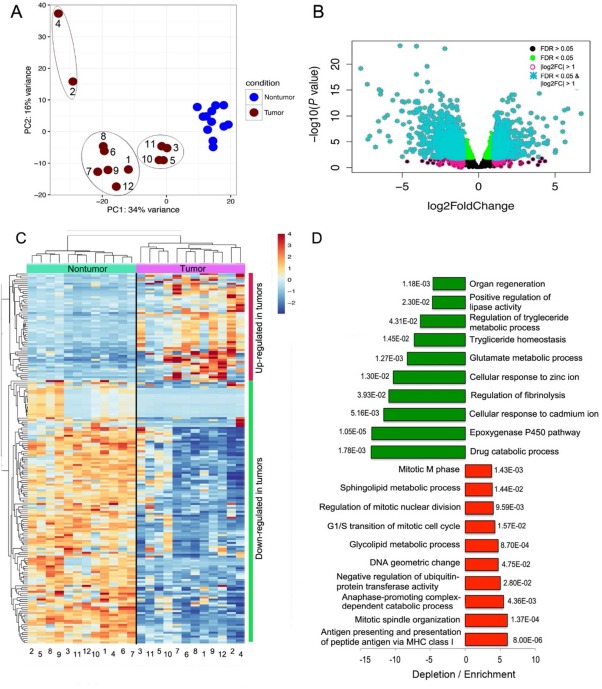
Figure 1.

Transcriptional deregulation in HCC resected tumors hints at down‐regulation of drug catabolic processes and activation of the immune system. (A) PCA separated tumor and nontumor samples. While nontumor samples formed a tight cluster, the tumor samples dispersed along the two axes (components), forming apparent subclusters. (B) Classification of differentially expressed genes according to FDR and log2 fold change. Deregulated genes with an FDR <0.05 (green dots) and log2 fold change > 1 were considered truly differentially expressed (turquoise asterisks). (C) Hierarchical clustering of the 200 deregulated genes that exhibited the largest variance also separated tumor and nontumor samples into separate branches of a dendrogram, with larger distances in the tumor branches. Tumors were divided into the same subclusters illustrated in the PCA plot. (D) GO analyses were conducted in the Gene Ontology Consortium web portal (http://www.geneontology.org/). The 10 most enriched or most depleted terms are presented along with the corresponding P values. In general, the magnitude of depletion is larger than the magnitude of enrichment. The most diminished terms are related to drug catabolic processes and the epoxygenase P450 pathway; the top enriched terms are related to antigen presentation, DNA synthesis, and mitosis. Abbreviation: MHC, major histocompatibility complex.
