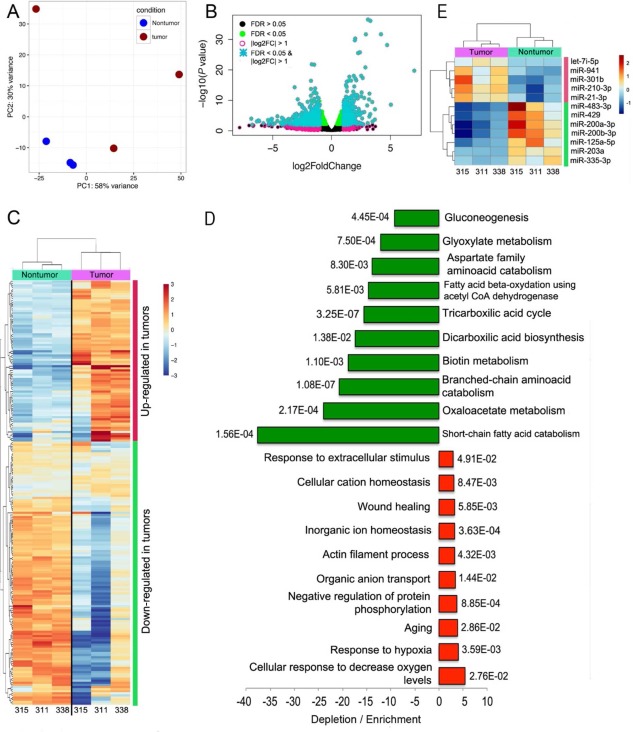
Figure 4.

Transcriptional deregulation in HCC from LT recipients suggests general reduction of energy‐producing processes. (A) PCA separated nontumor from tumor samples that adopted a more dispersed distribution along the two principal components. One of the tumors (315) was in close proximity to nontumor samples. (B) Classification of truly differentially expressed genes was performed using an FDR <0.05 (green dots) and log2 fold change > 1 (turquoise asterisks). (C) Hierarchical clustering using the 200 deregulated genes that exhibited the largest variance also separated tumor and nontumor samples into separate branches of a dendrogram, with larger distances in the tumor branches. (D) Gene ontology analyses show the 10 most enriched or depleted terms with the corresponding P values. The magnitude is larger for depletion than for enrichment. (E) Few miRNAs were found deregulated in tumor samples, most of which have been characterized in the context of HCC. Dots represent values of individual samples. Upper and lower borders of boxes represent upper limits of the third and first quartiles, respectively. Line in the middle of boxes represent the median. Whiskers represent scores outside the middle 50% of values. Abbreviations: CoA, coenzyme A; let‐7, lethal‐7 family of miRNAs.
