Figure 5.

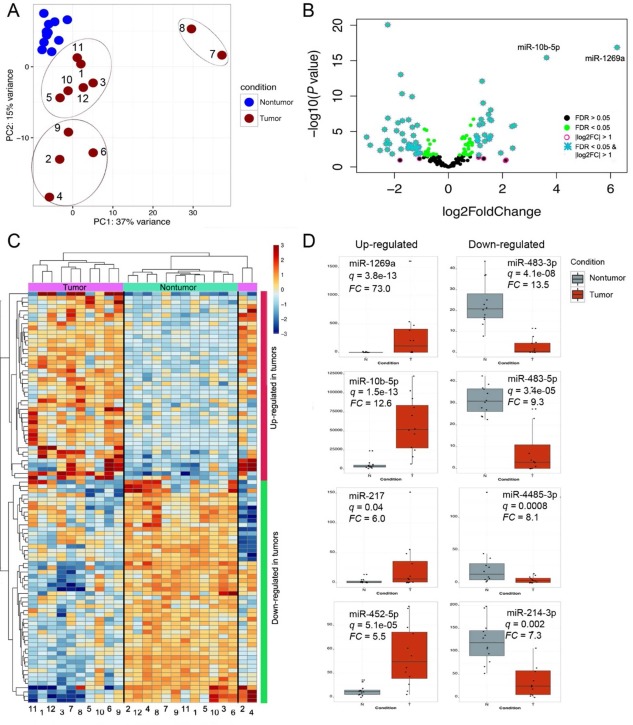
miRNA profiling reveals deregulated miRNAs that have not been previously characterized in HCC. (A) PCA of the miRNA expression data separated nontumor samples from tumor samples. Tumors 7 and 8 were considerably different from the rest of tumors in the two other sub‐clusters. (B) Classification of truly differentially expressed miRNAs was performed with an FDR <0.05 (green dots) and log2 fold change > 1 (turquoise asterisks). miR‐10b‐5p and miR‐1269a were substantially more deregulated than the rest of the miRNAs and for this reason are explicitly shown here. (C) Hierarchical clustering of 96 deregulated miRNAs exhibiting the largest variance separated most tumor from nontumor samples, except for tumors 2 and 4, which formed a branch apart and closer to nontumor samples. (D) The top four up‐regulated or down‐regulated miRNAs are shown. Abbreviation: FC, fold change.
