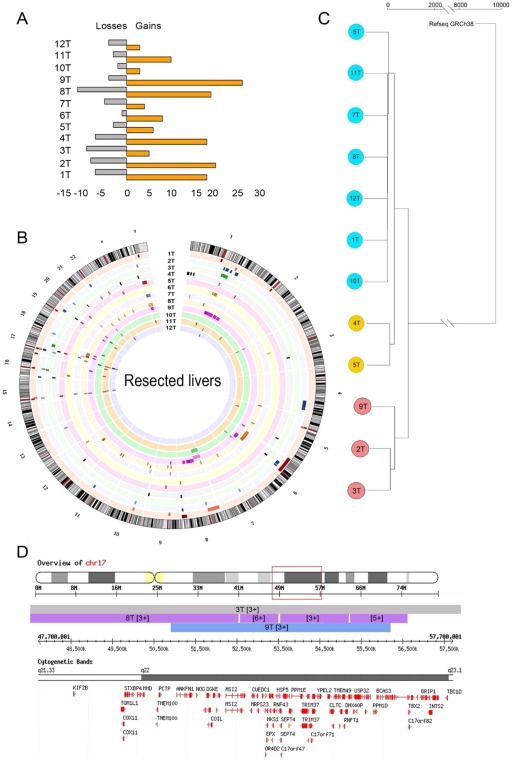
Figure 6.

CNV profile is highly variable between samples and is generally associated with amplification of oncogenes. (A) Number of CNV events (losses and gains) in each of the liver resection HCC samples. (B) Ideogram depicting the location and size of the CNV events in each liver resection HCC sample (copy number shown in http://onlinelibrary.wiley.com/doi/10.1002/hep4.1197/full). Each sample is represented in a distinct color. (C) A dendrogram was derived from the CNV profiles using hierarchical clustering with complete linkage and the GRCh38.81 human genome assembly as root. For each tumor sample, its nontumor counterpart was used as reference. (D) A representative region on chromosome 17 amplified in tumor samples 3, 8, and 9 is shown encoding genes associated with cell proliferation and metastasis. Genes TOM1L1, MSI2, MRPS23, RNF43, and INTS2 were found up‐regulated in the RNAseq libraries. (Also see http://onlinelibrary.wiley.com/doi/10.1002/hep4.1197/full showing CNV on chromosomes 1 and 17; cytogenetic bands and genes included in the corresponding transect are shown for the sake of clarity). Abbreviations: chr, chromosome; INTS2, integrator complex subunit 2; MRPS23, mitochondrial ribosomal protein S23; MS12 minisatellites detected by probe MMS12; RNF43, ring finger protein 43; T, tumor sample; TOM1L1, target of myb1‐like 1 membrane trafficking protein.
