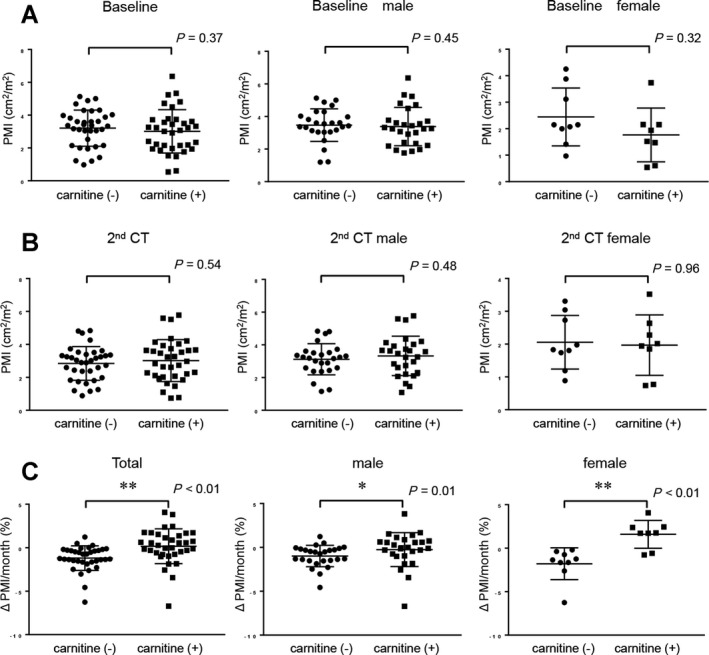
Figure 2.

Comparison of PMI and Δ PMI/month in patients with L‐carnitine supplementation and controls. (A) Comparison of baseline PMI in patients with L‐carnitine supplementation and controls (overall cohort, males, and females). (B) Comparison of PMI at the second CT examination point in patients with L‐carnitine supplementation and controls (overall cohort, males, and females). (C) Comparison of Δ PMI/month in patients with L‐carnitine supplementation and controls (overall cohort, males, and females). Data were analyzed with the Mann‐Whitney U test. Asterisk indicates a statistically significant difference (*P < 0.05, **P < 0.01).
