Figure 1.

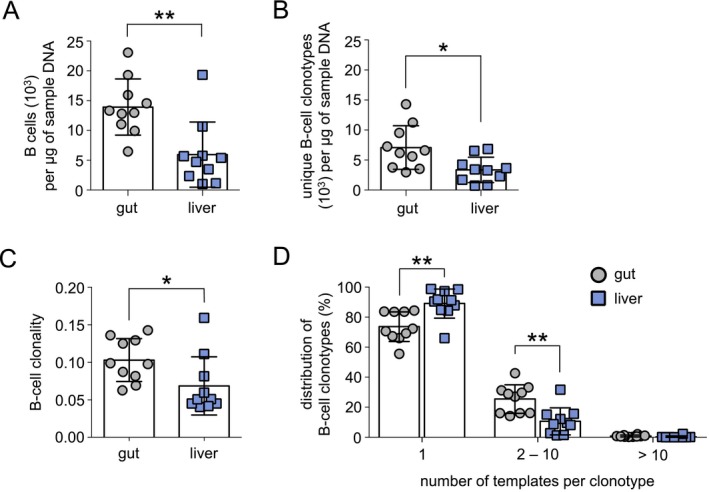
B‐cell clonality in the gut is greater than in the liver in patients with PSC‐IBD. High‐throughput BCR sequencing was completed on paired gut and liver samples from patients with PSC‐IBD (n = 10). (A) B cell/μg of tissue DNA as measured by the total number of templates for a specific BCR rearrangement/μg of sample DNA. B‐cell clonotypes were defined as a productive nucleotide BCR rearrangement with a distinct IgH CDR3. (B) Number of unique B‐cell clonotypes/μg of tissue DNA. (C) Clonality of the gut and liver B‐cell compartment as defined by the relative expansion of each B‐cell clonotype and calculated as 1 − (Shannon's Entropy)/log2 × (number of productive nucleotide clonotypes). A clonality of 1 represents a monoclonal sample, whereas a clonality of 0 represents a completely polyclonal sample. (D) Clonal distribution of each B‐cell clonotype as defined by the number of BCR templates in the sample. B‐cell clonotypes detected only once per sample most likely represent naive B cells, whereas B‐cell clonotypes found at 2‐10 templates have expanded. Clonotypes found at greater than 10 templates per sample represent highly‐expanded B cells. Horizontal lines indicate the mean, and error bars indicate SD. Statistical significance was determined using non‐parametric paired t tests, *P < 0.05, **P < 0.01.
