Figure 3.

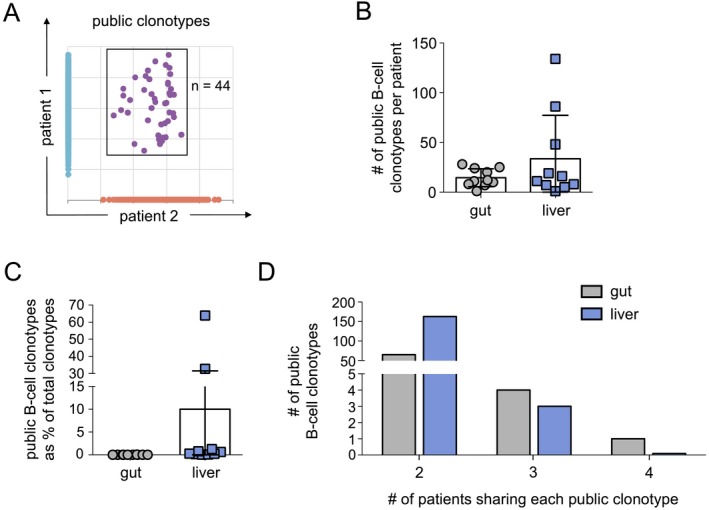
Public gut and public liver B‐cell clonotypes are found in patients with PSC‐IBD. (A) Representative scatter plot indicates the number of shared B‐cell clonotypes between liver samples from different patients. Clonotypes exclusive to patient 1 are shown in blue (y axis), clonotypes restricted to patient 2 are shown in orange (x axis), and shared clonotypes (public clonotypes) detected in both samples are in purple and gated. (B) Number of public gut and public liver B‐cell clonotypes detected in each patient (n = 10). (C) Public B‐cell clonotypes as a proportion (%) of the total gut and liver clonotypes among each patient (n = 10). (D) Number of public gut and public liver B‐cell clonotypes shared among n = 2, n = 3, and n = 4 patients. No public gut or public liver clonotypes were found in more than 4 patients. Bars indicate the mean, and error bars indicate the SD. Differences between gut and liver clonotypes in (B) and (C) are not significant as determined by non‐parametric unpaired t tests; P > 0.05.
