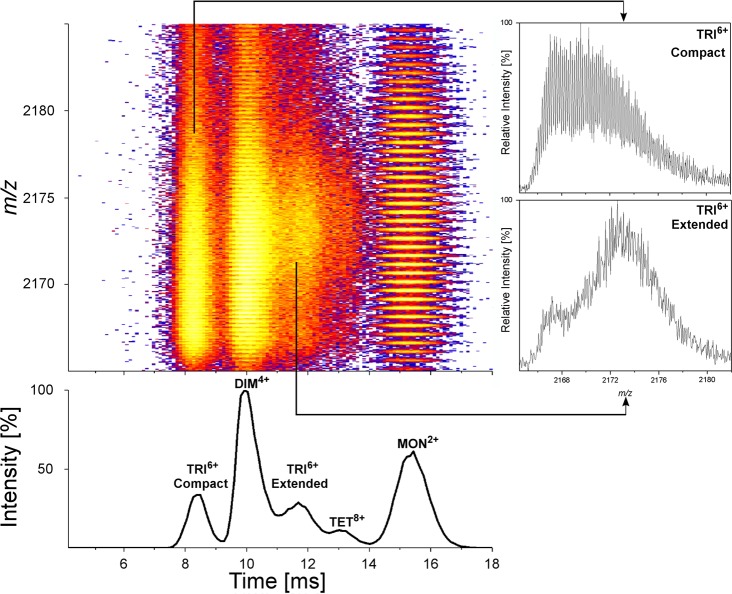
Fig 5. Enlarged fragment of a two dimensional IM-MS spectrum of WT Aβ 1–40 after exchange (flow 40 mL/min) focusing on 2164–2185 m/z range.
Vertical axis in the colored panel shows m/z whereas horizontal axis the ion mobility drift time. The colored spots indicate MS peaks with amplitude increasing from purple to yellow. Signals corresponding to MON2+, DIM4+, TRI6+, TET8+ were identified based on the analysis of signal spacing in the isotopic envelopes, as shown previously [43]. Cross sections of isotopic envelopes at two drift times indicated by arrows, corresponding to two alternative TRI6+ structural forms (insets) show the difference in the distribution of signals after exchange between a more compact form of shorter drift time (upper inset) and a more extended one, characterized by a longer drift time (lower inset). For the extended form the slow exchanging species are minor in contrast to compact form. Projection of this region on the drift time axis (lower panel—vertical axis: signal intensity) shows relative amplitudes of the five signal groups.

