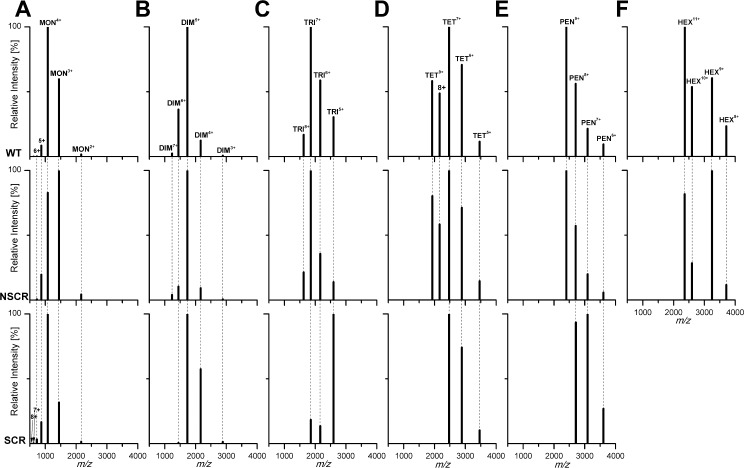
Fig 6.
Charge state distributions of MS signals of: (A) monomers, (B) dimers, (C) trimers, (D) tetramers, (E) pentamers, (F) hexamers of WT Aβ 1–40 (upper panels), NSCR Aβ 1–40 (middle panels) and SCR Aβ 1–40 (lower panels), extracted from IM-MS data, with the height of each signal equal to the maximum value of the signal in the corresponding charge envelope. In SCR, DIM7+ was missing, DIM6+ was less intense, and DIM4+ was more intense. The charge state envelope was in some instances (dimers, trimers, pentamers) shifted towards a lower charge in SCR. For trimers, the dominant form was 5+ in SCR and 7+ in both WT and NSCR, while the 8+ form was missing in SCR. TET8+ and TET9+ were missing in SCR but the remaining 7+, 6+, and 5+ signals retained the same mutual amplitude. A major PEN9+ signal in WT and NSCR was missing in SCR, for which PEN7+ was predominant. Hexameric signals are absent in SCR.

